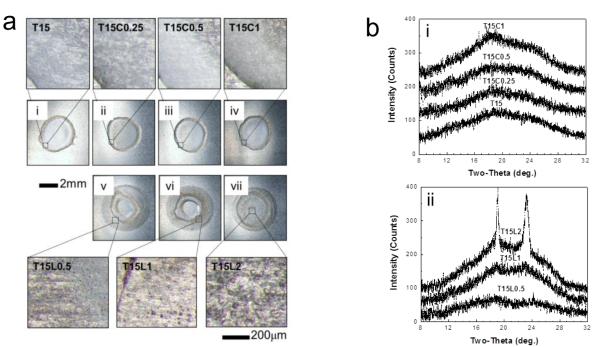
Fig. 2.
Phase transformations in coatings containing CMC or Lutrol on plasma-cleaned Ti plates, (a) Brightfield optical microscopy images of vaccine coatings on Ti plates. Coating samples with 1 μg of virus protein were prepared at room temperature and micrographs were taken after incubation at room temperature for one day. Micrographs (i)-(vii) represented in (a) were obtained by monitoring the morphological changes of the same samples as shown in Fig. 1. Coating formulations were as follows: (i) T15; (ii) T15C0.25; (iii) T15C0.5; (iv) T15C1; (v) T15L0.5; (vi) T15L1; (vii) T15L2. The magnified images (below) show the typical morphology of phase-separated samples with bumps in images (v)-(vii). Images are representative of n = 6 replicate samples examined at each condition, (b) X-ray diffraction (XRD) patterns corresponding to (i)-(vii) shown in part (a), (i) XRD spectra measured from T15, T15C0.25, T15C0.5, and T15C1 coatings, (ii) XRD spectra measured from coating formulations containing T15L0.5, T15L1 and T15L2. Structural analysis was performed by comparing observed characteristic XRD peaks with simulation results based on cell information of trehalose-dihydrate and trehalose anhydrous forms [27]. XRD patterns observed from T15L1 and T15L2 contain characteristic peaks for crystalline trehalose-dihydrate. The intensity of crystalline peaks increased with increasing Lutrol concentration. This indicates that trehalose crystallization is enhanced by the presence of Lutrol in the vaccine coating formulation. Magnified XRD spectra corresponding to T15L1 and T15L2 can be found in Fig. SI together with the percent crystallinity. Spectra are representative of n = 6 replicate samples examined at each condition.

