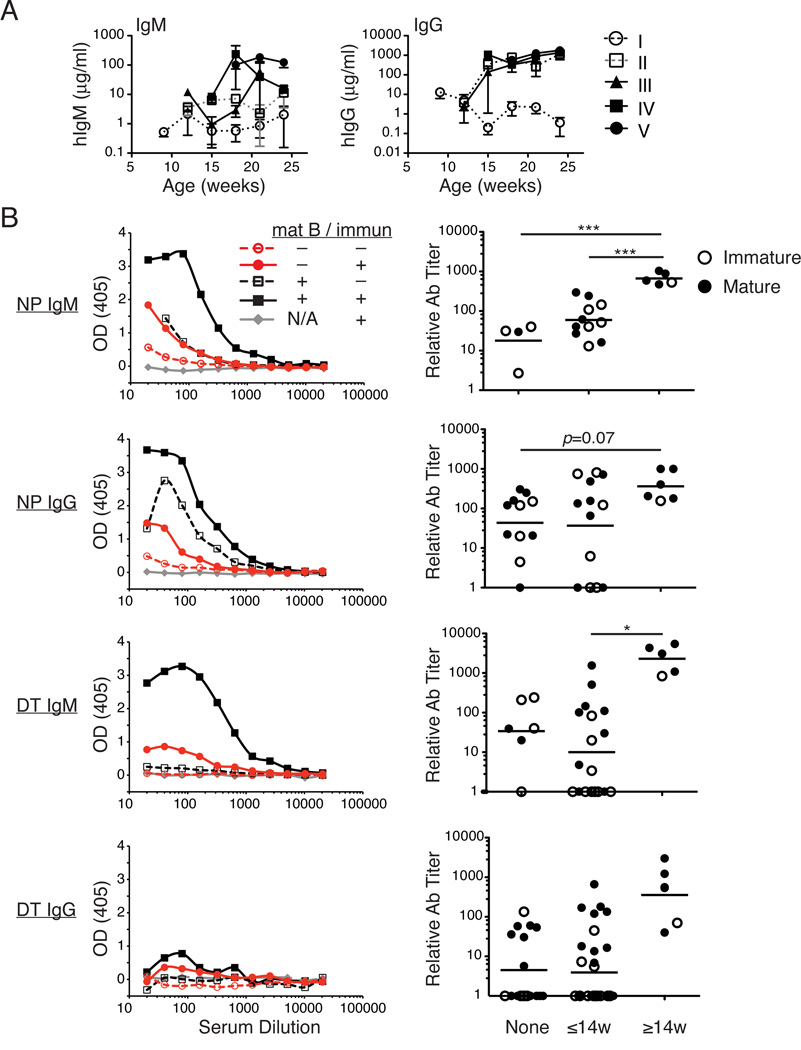
FIGURE 4.
Improved Ab responses to TI and TD immunizations in hu-mice with mature B cells. (A) Concentration (µg/ml) of hIgM (left) and hIgG (right) in sera of hu-mice of categories I–V. The data represent the mean ± SEM of n = 3–17 samples per time point and per category with the exception of category III, 12 wks (n = 1). (B) Hu-mice were immunized or not with either the TI-II Ag NP-Ficoll (top four panels) or the TD Ag DTaP (bottom four panels) between 8 and 14 (≤14) or 14 and 22 (≥14) wks of age as described in Materials and Methods. Left panels show representative ELISA curves with OD405 on the y-axis and sera dilutions on the x-axis. Each graph includes hu-mice that were immunized (intact line, filled symbols) or not (dashed line, empty symbols) and that displayed mostly mature (black lines) or immature (red lines) B cells, and relative to an immunized intact BALB/c-DKO mouse. The right panels show relative Ab titers (calculated as described in Materials and Methods) in hu-mice that were non-immunized (None), or immunized before (≤14w) or after (≥14w) 14 wks of age, and displaying mature B cells (closed circles) or immature B cells (open circles) in the spleen. (*p<0.05, ***p<0.001)

