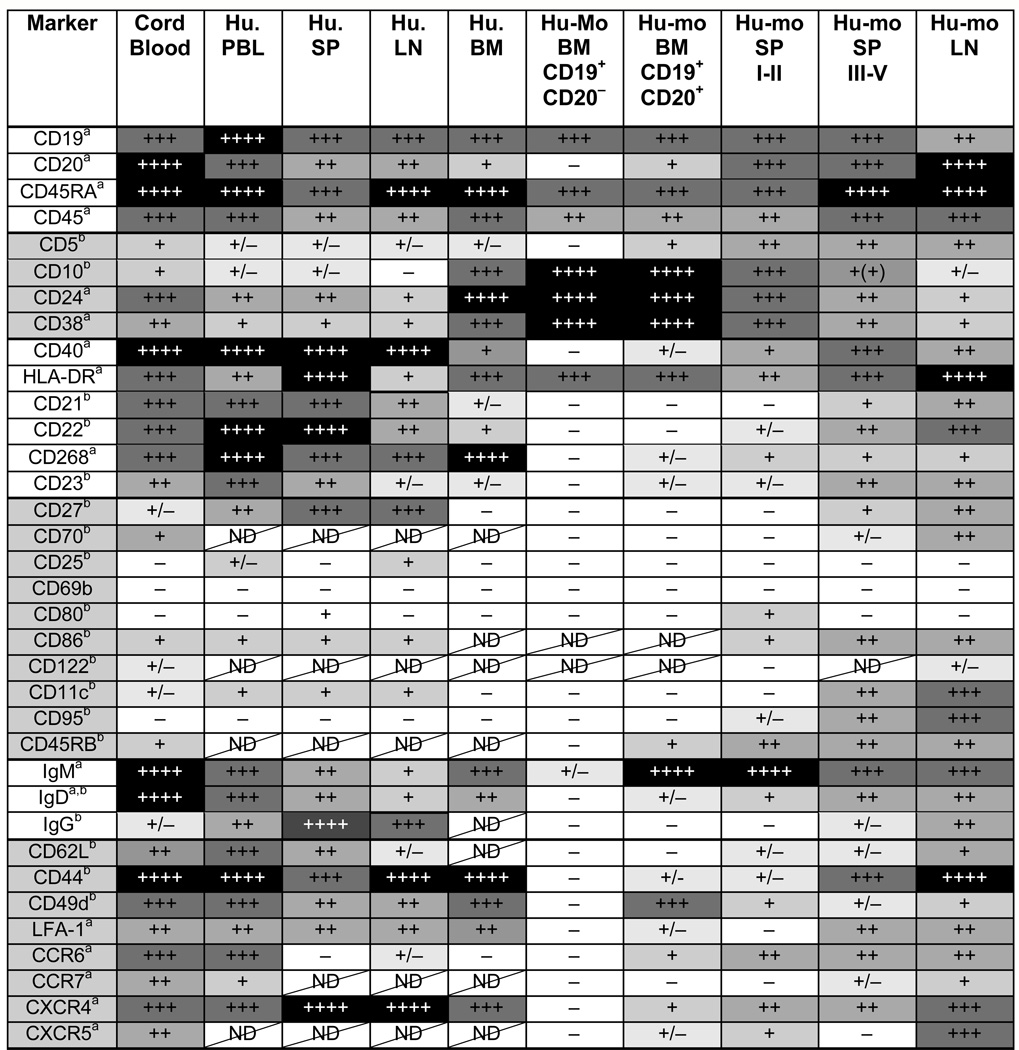
Table I.
Characterization of B cells in tissues from humans and hu-mice
 |
Analysis of protein expression was performed by flow cytometry on gated human (Hu.) and humouse (Hu-mo.) B cells defined as hCD45+ and CD19+ and/or CD20+. In the bone marrow (BM) of hu-mice, analysis was also performed on the developmental early fraction of CD19+CD20− B cells. Analysis of spleen B cells from hu-mice is separated for mice of categories I–II and III–V. The relative protein expression level (a) or frequency of positive cells (b) is depicted in a grayscale format and with + and − symbols, with black and ++++ representing the highest expression (a) or frequency (b). ND = not determined.
