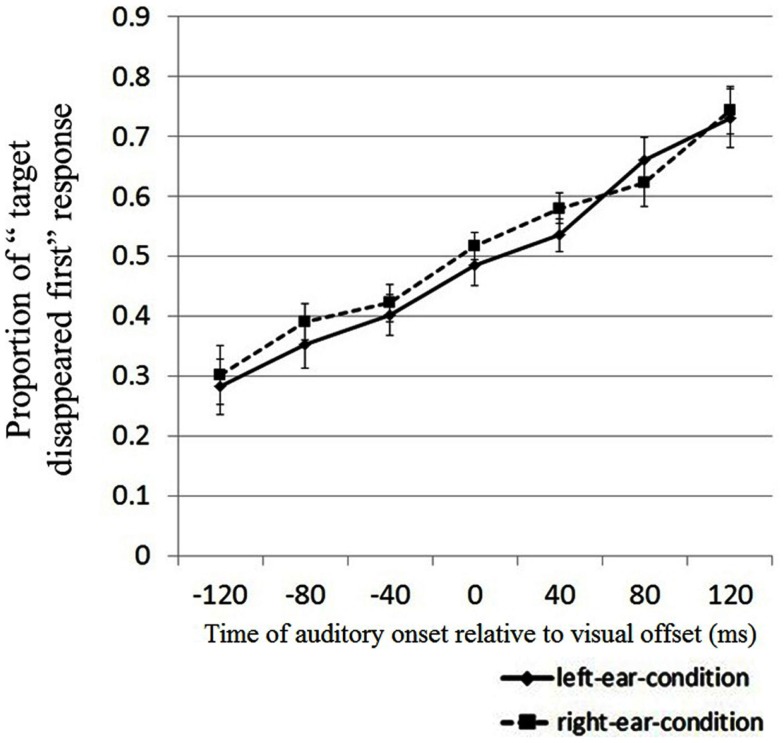
Figure 4.
Results of Experiment 3. The horizontal and vertical axes represent the different sound presentation conditions and the proportion of “target disappeared first” responses, respectively. Error bars represent within-participants SEMs (Loftus and Masson, 1994; Cousineau, 2005) for each presentation.

