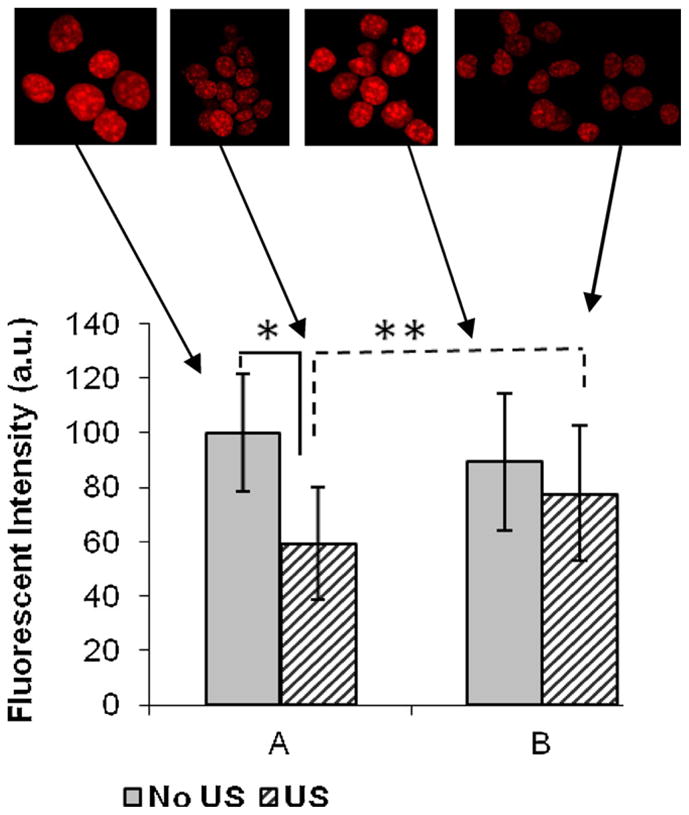
Fig. 2.

Quantitative evaluation of the relative fluorescent intensities of DAPI stained nuclei. The fluorescent intensity DAPI stained nuclei were imaged using ImageJ™. “A” denotes nuclei that were analyzed immediately with minimal time lag and “B” denotes nuclei that were assayed upon incubation at 4 °C for 45-min. The decrease in intensity in US nuclei (*) is statistically significant (p < 0.01, n = 60) compared to control (non-stimulated) cells. The increase in DAPI intensity after 40 min at 4 °C is statistically different from the initial intensity (**p < 0.001, n = 100).
