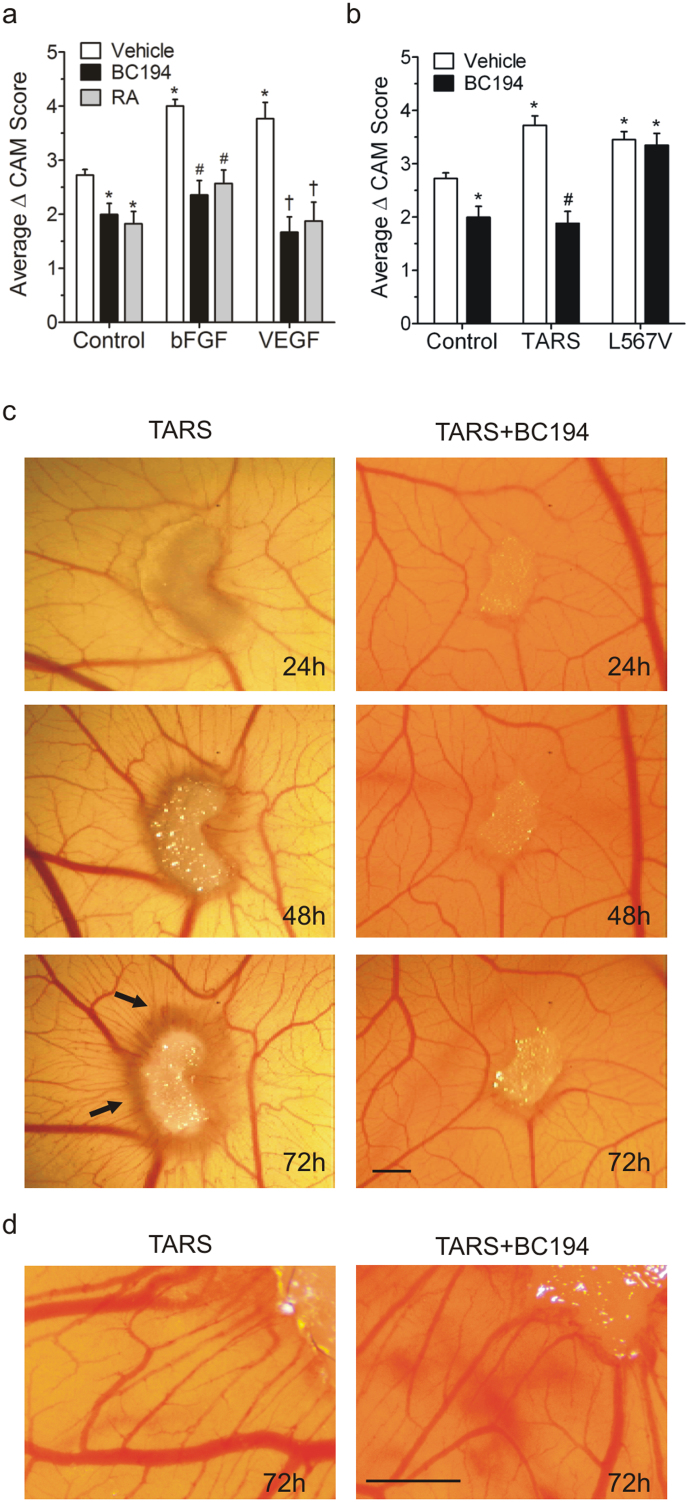
Figure 4. TARS affects in vivo angiogenesis in a CAM assay.
Fertilized chicken embryos were cultured ex-ova. At developmental day 10, agents were applied daily to gelfoam sponges on the CAM. Images were recorded daily and graphs represent the change in CAM vascularity score over 72 h. (a) BC194 (0.1 pmol) was applied to the CAM along with PBS (Control), bFGF (400 ng), and VEGF (20 ng). The angiostatic control retinoic acid (RA) was used at 1 μg; n ≥ 8, *,#,† P < 0.001 compared to Control, bFGF and VEGF respectively (one-way ANOVA, Tukey test). Representative images for (a) are shown in Fig. S2. For (b,c) 10 pmol of purified recombinant TARS, BC194-resistant mutant TARS (L567V) and/or BC194 were applied. (b) Histogram of change in CAM vascularity score over 72 h; mean ± s.e.m., n ≥ 15, *P < 0.001 compared to PBS Control; #p < 0.001 compared to TARS (one-way ANOVA, Tukey test). (c) Representative CAM images over time; arrows denote spoke-wheel response. Scale bar = 1.0 mm. (d) 72 h CAM images taken at higher magnification and resolution to show individual microvessels. Scale bar = 1.0 mm.

