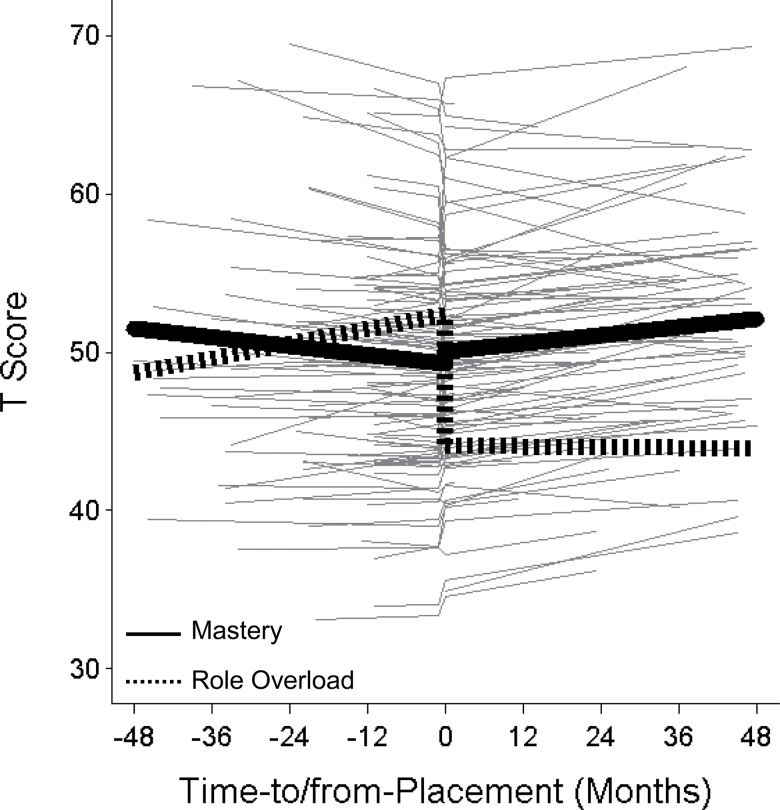
Figure 1.
Graphical illustration of how changes in global sense of mastery and role overload correspond with one another in relation to placement. Model-implied mean longitudinal change trajectories are shown from Model 1 in Table 4 for mastery and role overload in relation to placement. Mastery declined prior to placement, but the transition of placement altered the caregiver’s trajectory of change with an increase in mastery within 1 year of placement, followed by a gradual increase (solid black line). Role overload increased in the years leading up to placement, precipitously dropped within 1 year of placement and was stable in the years thereafter (dotted black line). Prior to placement, higher role overload was related to lower mastery, and postplacement the picture was reversed, with individuals experiencing less role overload and higher mastery. To illustrate, predicted scores are shown for a subsample of 100 participants.

