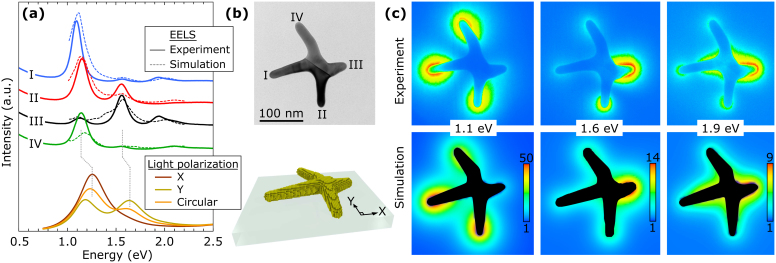
Figure 2. EELS experiment and DDA/GDM simulations on a gold nanocross.
(a) GDM-simulated spectra (thin dotted lines) and experimental EELS spectra (thick lines), vertically shifted for clarity, including the ‘zero-loss peak’ background signal. The spectra were acquired 1–2 nm off the tip of the four arms at locations I–IV. Bottom: DDA-simulated excitation spectra upon illumination with polarized light, showing the two bright plasmon modes. (b) Top: TEM image of the gold nanocross, with locations I–IV indicated. The schematic at the bottom shows the model that was used for the DDA and GDM simulations. (c) Energy-filtered plasmon maps, showing the spatial distribution of EELS losses in 0.2 eV wide energy windows at the three main plasmon resonances for this nanocross, at 1.1, 1.6, and 1.9 eV. The experimental results (top) have the same colour table as the simulations (bottom), mapping the local EELS amplitude.

