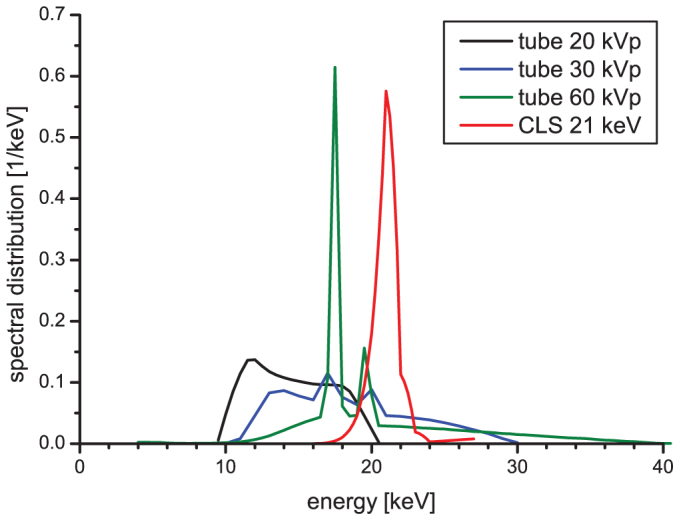
Figure 2. X-ray spectra for the experiment.

Black, blue and green lines: Spectra of the FR591 rotating anode X-ray tube at peak voltages of 20, 30 and 60 kVp calculated from the measured values of the linear absorption coefficient μ of the water phantom with an expectation maximization algorithm according to Sidky et al.9,10. Red line: Spectrum of the Compact Light Source at 21 keV calculated from the measured values of the linear absorption coefficient μ of the water phantom. For a measured spectrum of the CLS at 21 keV see Supplementary Fig. S1 online.
