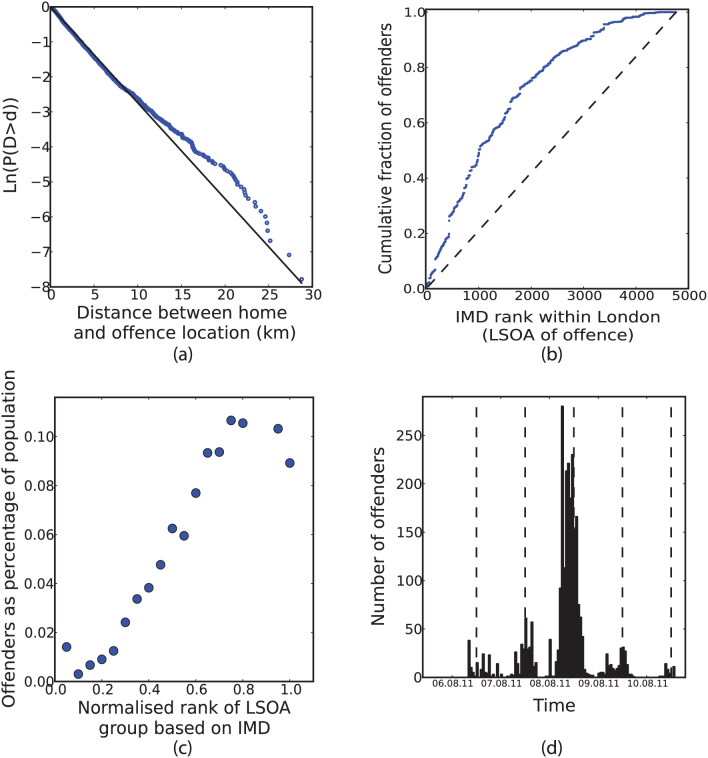
Figure 1. Observations from arrest data.
(a) Log-linear plot of the complementary cumulative distribution function of D, the distance between residential and offence locations. The straight line shows a hypothetical exponential distribution with parameter 0.274 (±0.01 for a 95% confidence interval), for which the Kolmogorov-Smirnov distance statistic is 0.0246 (which compares with 0.332 for the equivalent fitted power-law). (b) Lorenz curve for the distribution of riot locations amongst Lower Super Output Areas (LSOAs; UK census units with average population approximately 1,500) ranked according to deprivation (where 1 is most deprived). The dashed line represents perfect equality. (c) Relationship between area-level deprivation and the proportion of residents involved in disorder, where the horizontal axis represents a score derived from IMD so that all values lie in [0, 1] and so that London's most deprived area is given a value of 1. d) Temporal distribution of recorded crime.

