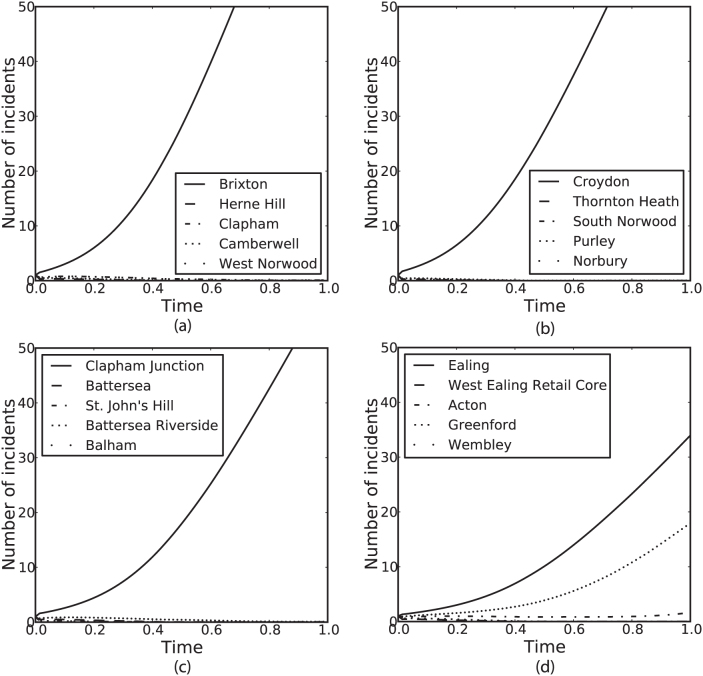
Figure 4. The susceptibility of retail sites.
For each of the four centres worst affected in the riots: (a) Brixton, (b) Croydon, (c) Clapham Junction and (d) Ealing, we ran four separate simulations, pairing the site of interest with each of its closest geographical neighbours in turn. An initial disturbance of one rioter was included at both sites and the model run to allow the incidents to evolve. Results shown for the sites of interest are the average of their four simulations, and in each case substantial growth is seen, particularly in comparison to the neighbouring centres.

