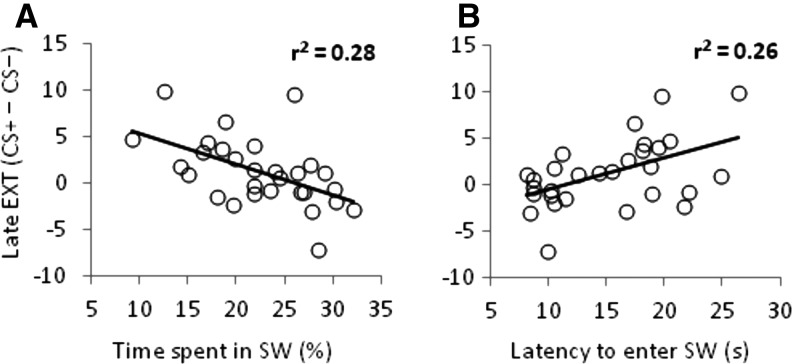
Figure 3.
Avoidant behavior and fear expression during late extinction are robustly correlated. Scatterplots with least squares lines (A) depict the negative association between time spent in the SW quadrant of the test pool and differential startle reactivity to the CS+ during late extinction, and (B) depict the positive association between latency to enter the SW quadrant of the test pool and differential startle reactivity to the CS+ during late extinction.

