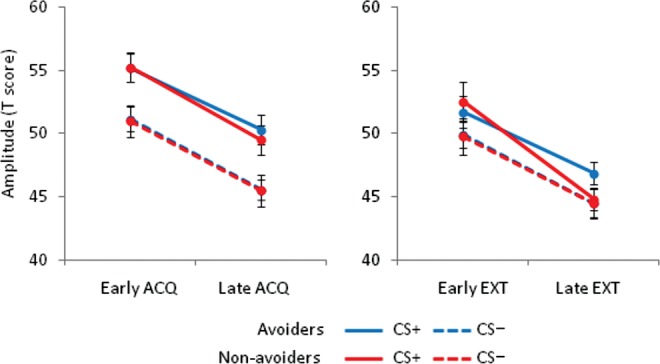
Figure 4.

Passive avoidance is linked to continued fear expression. The sample was split, for illustrative purposes, into avoiders (N = 18) and nonavoiders (N = 11) based on time spent in the SW quadrant of the test pool (<25% and ≥25%, respectively). Both groups show similar levels of differential startle reactivity during acquisition and early extinction, but only the avoiders continued to show elevated startle to the CS+ during late extinction. Note that the blue dotted line is partially occluded by the red one because startle responding during the CS− was nearly identical for avoiders and nonavoiders.
