Figure 6.
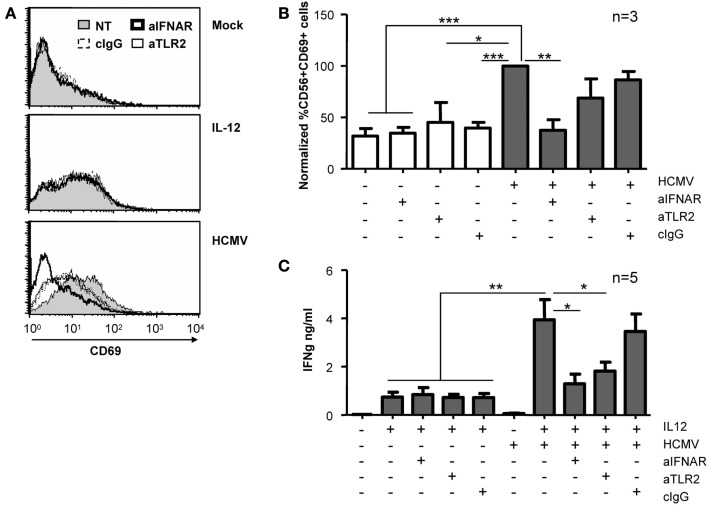
Effect of IFNAR and TLR2 blockade on NK cell activation. Freshly purified NK cells were left untreated or incubated with HCMV and IL-12 in the presence or absence of antagonizing antibodies for TLR2 and IFNAR. CD69 expression (A,B) and IFNγ secretion (C) were monitored at 24 h by flow cytometry and ELISA, respectively. (A) Histograms depict surface CD69 expression on NK cells in the absence of blocking mAbs (NT, gray profiles) or when cultures included anti-IFNAR (bold lines), anti-TLR2 (thin lines), or control IgG (dashed lines). Results from one representative donor are shown. (B) Bar graph showing the mean ± SEM of the normalized expression of CD69. Data in each experiment were normalized to the CD69 expressed by NK cells exposed to HCMV in the absence of blocking reagents (100%). (C) Bars graph displaying the mean ± SEM of IFNγ secretion in five donors. Statistic analysis by the Student t-test (*p < 0.05; **p < 0.01; ***p < 0.0001).

