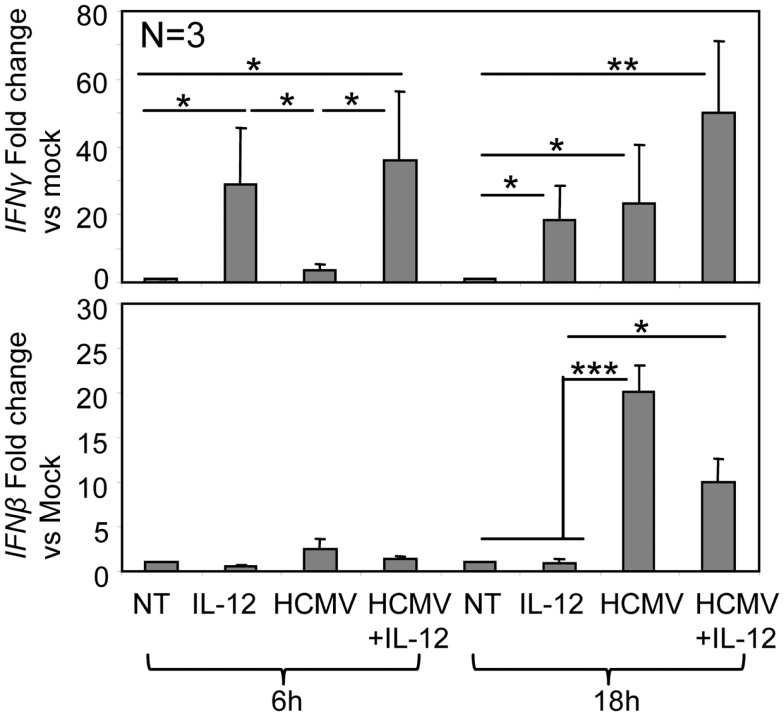
Figure 7.
IFNγ and IFNβ mRNA in NK cells along co-culture with HCMV. Real-time PCR was performed on mRNA isolated from purified NK cells treated with IL-12 and HCMV TB40/E alone or in combination, for 6 and 18 h. Bar graphs indicate expression levels of IFNγ and IFNβ transcripts. GAPDH was used to internally standardize the levels of gene expression. Data are expressed as fold difference between non-treated cells (whose levels of gene expression have been assumed as 1) and cells cultured with different stimuli. Bar graphs include results obtained with NK cells purified from three different donors (mean ± SD). Statistic analysis by the Student t-test (*p < 0.05; **p < 0.01; ***p < 0.0001).

