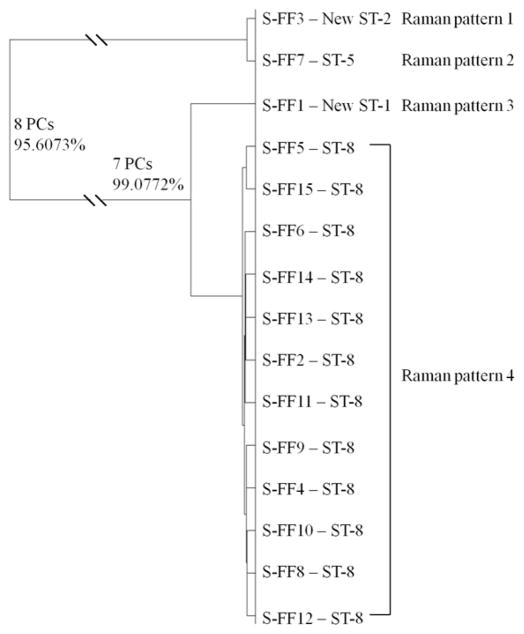
Figure 3.
Hierarchical cluster analysis of MRSA clinical isolates from the United States. Full details of the numbers of PCs determined at each level and the associated percentages of explained variance are shown. This dendrogram shows the reproducibility and concordance of optofluidic-based Raman typing and MLST.

