Figure 2.
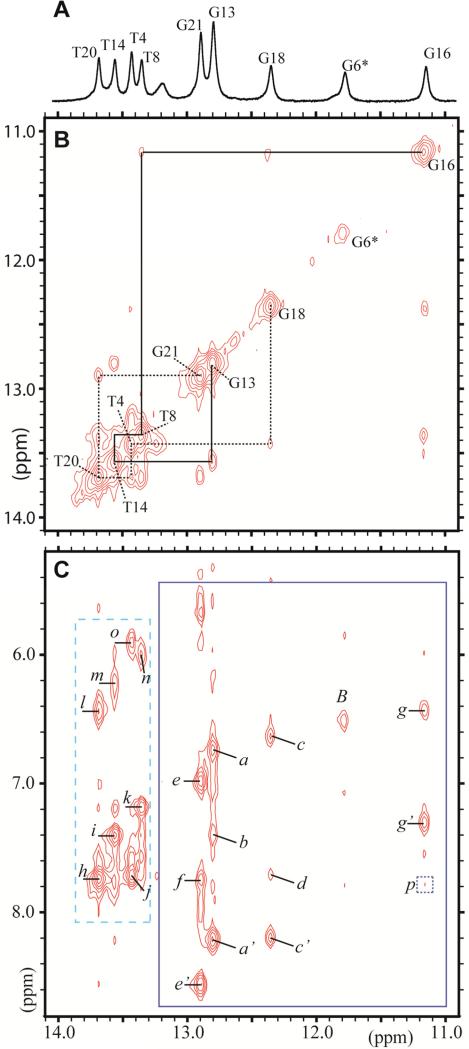
The 1-D and 2-D NMR spectra of the DB[a,l]P-dG adduct in the 11mer duplex in H2O buffer (pH 6.8) was recorded using a 500 MHz spectrometer. (A) The 1-D spectrum (10.9–14.1 ppm) at 5°C indicates the imino proton assignments. (B) Portion of a 2D NOESY (150 ms mixing time) contour plot at 1°C, in H2O buffer solution showing the neighboring imino-imino NOE connectivities that can be followed from G18 to G21 on the 5’-side of G6*:C17 (dotted line), and from G16 to G13 on the 3’-side of G6*:C17 ( solid line). The connectivities between G* and G16, G18 are missing. (C) Portion of a 2D NOESY (same conditions as B) showing the NOE connectivities between imino (11.0–13.8 ppm) and amino/base (5.5–8.8 ppm) protons. The rectangle with the dashed borders shows the characteristic Watson-Crick hydrogen bonded thymine imino to adenine H2 proton NOEs. The rectangle with solid borders shows the guanine imino proton - cytosine amino proton connectivities.
The cross peaks labeled a to o identifing DNA NOEs are assigned as follows, where ‘b’ and ‘nb’ define hydrogen-bonded and non-hydrogen-bonded amino protons, respectively): : a, C10(N4H)nb – G13(N1H); a’, C10(N4H)b – G13(N1H); b, A9(H2) – G13(N1H); c, C5(N4H)nb – G18(N1H); c’, C5(N4H)b – G18(N1H); d, A19(H2) – G18(N1H); e, C2(N4H)nb – G21(N1H); e’, C2(N4H)b – G21(N1H); f, A3(H2) – G21(N1H); g, C7(N4H)nb – G16(N1H); g’, C7(N4H)b – G16(N1H); h, A3(H2) – T20 (N3H); i, A9(H2) – T14 (N3H); j, A19(H2) – T4 (N3H); k, A15(H2) – T8 (N3H); l, A3(N6H) – T20 (N3H); m, A9(N6H) – T14 (N3H); n, A15(N6H) – T8 (N3H); o, A19(N6H) – T4 (N3H); p (square with dotted borders),G16(N1H) – DB[a,l]P(H1).

