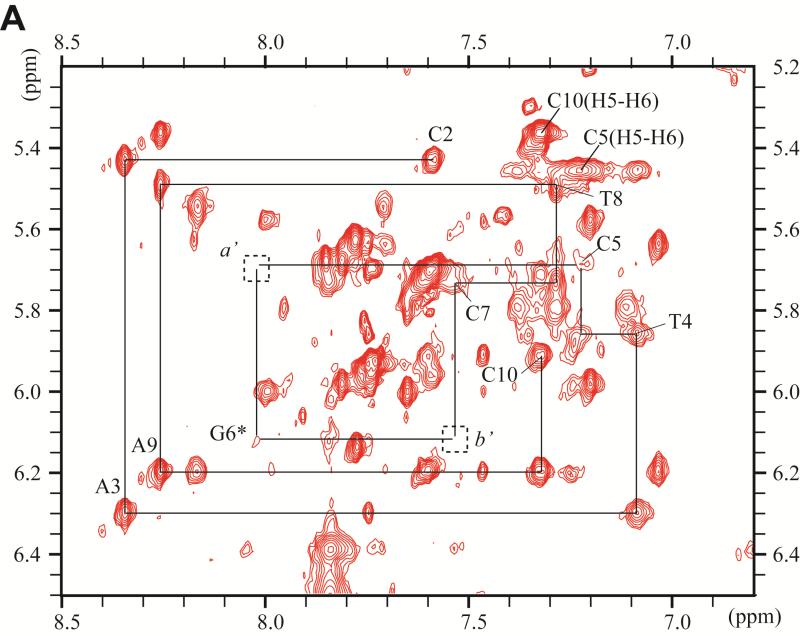
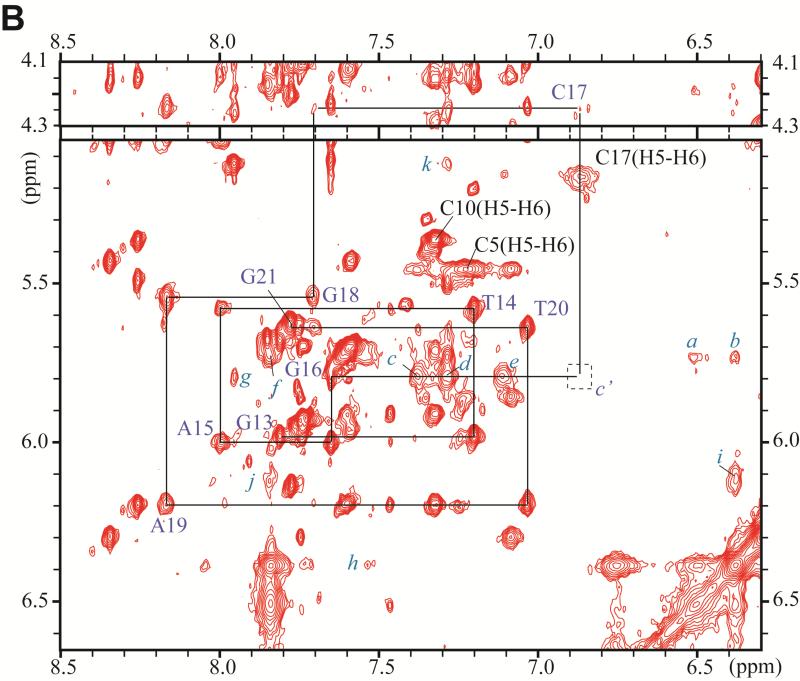
Figure 3.
Expanded contour plot of a NOESY spectrum (200ms mixing time) of the DB[a,l]P-dG lesion in the 11-mer duplex in D2O aqueous buffer solutions using a 500MHz spectrometer equipped with a cryoprobe at 28°C; in these 2-D plots, the horizontal axis defines the purine H8, and pyrimidine H5 or H6 chemical shifts, while the ordinate defines the deoxyribose H1’ proton chemical shifts. (A) Sequential assignment based on the connectivities between base protons and their own and 5′-flanking nucleotide H1′ deoxyribose protons for the C2-A3-T4-C5-G6*-C7-T8-A9-C10 segment. The NOEs can be followed from C2 to C5, and from C7 to C10. Connectivities are not observable between G6* and any of its flanking bases in this 2-D plot, but see Figure 4D for connectivities between G6* and C5. The squares labeled a′ and b′ identify the positions of the missing NOEs between C5 and G6*, and G6* and C7. (B) Sequential assignments for the unmodified strand in the segment G13-T14-A15-G16-C17-G18-A19-T20. The upper panel is cut lower than the bottom panel. Identification of NOE cross-peaks labeled a to k: between the DB[a,l]P moiety and DNA protons: a, C7(H1’) – DBP(H14); b, C7(H1’) – DBP(H2); c, G16(H1’) – DBP(H7); d, G16(H1’) – DBP(H9); e, G16(H1’) – DBP(H8); f, C7(H1’) – DBP(H1); g, G16(H1’) – DBP(H10); h, C7(H6) – DBP(H2); i, G6(H1’) – DBP(H2); j, G6(H1’) – DBP(H1); k, G6(H3’) – DBP(H9).
The square labeled c' identifies the position of the missing NOE beyweem G16(H1’) and C17(H6).


