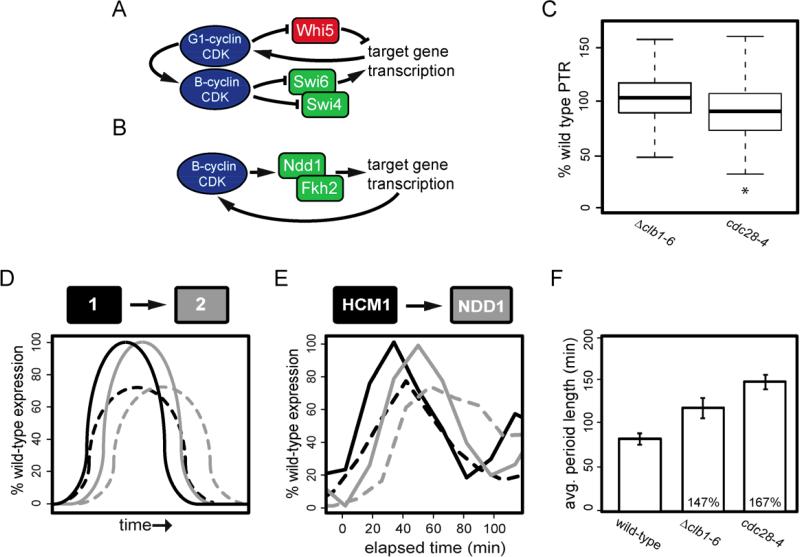
Figure 4. CDKs affect oscillations though feedback on the network oscillator.
(A and B) Examples of CDK regulation of transcription through positive (B) and both positive and negative feedback (A); kinase activities, blue; transcriptional activators, green; transcriptional repressors, red. (C) Box-and-whisker plots of PTRs for genes periodic in both Δclb1-6 and cdc28-4 cells calculated as the percent of wild-type control PTR (grown at 30° C for and 37° C for cdc28-4 cells). Whiskers extend to 1.5 times the interquartile range; asterisk (*) indicates significantly different PTRs between Δclb1-6 or cdc28-4 cells with respect to wild-type cells. (D) Model of amplitude loss; solid line, wild-type expression; broken line, expression in the absence of CDK activities. (E) Expression of HCM1, black, and NDD1, grey, normalized to maximum expression in wild-type cells; wild-type cells, solid line; Δclb1-6 cells, broken line. (F) Average period length in wild-type cells (including similar periods observed at both 30° and 37° C), B-cyclin mutant cells, and cdc28-4 cells. Values for wild-type cells were determined by CLOCCS (Orlando et al., 2007). For Δclb1-6 cells and cdc28-4 cells, average period length is determined through MCMC mixture modeling. Error bars represent standard deviation between the replicates, percent increase over appropriate wild-type periods are indicated for Δclb1-6 and cdc28-4 cells. Also see Table S4.

