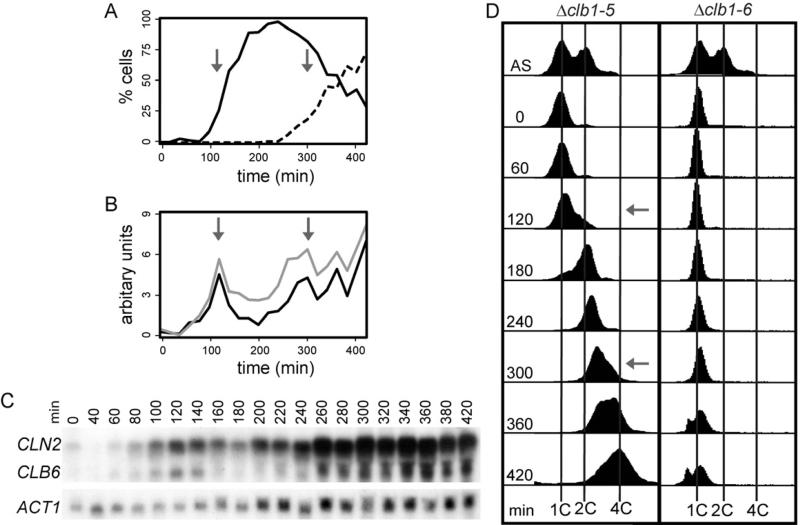
Figure 5. Periodic Expression of Clb6 drives cyclic activation of DNA replication.
Δclb1-5; GAL1pr-CLB1 cells were synchronized in G1 and released in presence of dextrose. Cells were monitored for bud emergence (A; solid line, one bud, broken line 2 buds), expression of CLN2 (grey) and CLB6 (black) by northern blot (B and C) and DNA content (D). (B) mRNA levels are plotted as the level of cyclin mRNA divided by the level of ACT1 at that time point. In all panels grey arrows signify the first (120 min) and second (300 min) peak of CLB6 expression. (D) DNA content is compared to Δclb1-6; GAL1pr-CLB1 cells. Accumulation of cells with less than 1C DNA content reflects the lysis of Δclb1-6 cells at late time points. Also see Figure S4.

