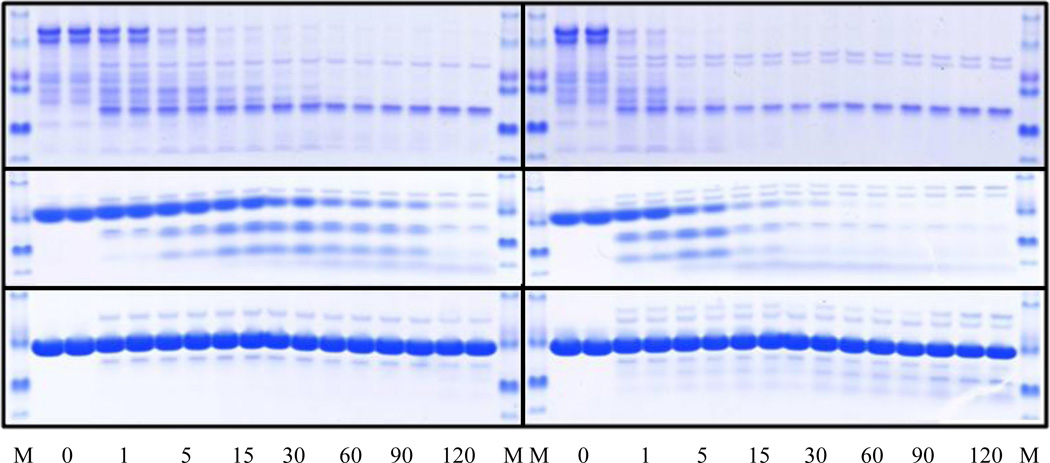
Figure 4.
Time course of the limited trypsin digestion of standard proteins by 0.2 µM trypsin (A, C, and E) and 1 µM trypsin (B, D, and F). Plots A and B show the digestion results for α-casein. Plots C and D represent the data on the apo-myoglobin trypsinolysis. Plots E and F illustrate tryptic cleavage of lysozyme. In each plot, the first and the last lanes correspond to the molecular mass standards. Numbers reflect the time points at which the proteolysis was quenched.

