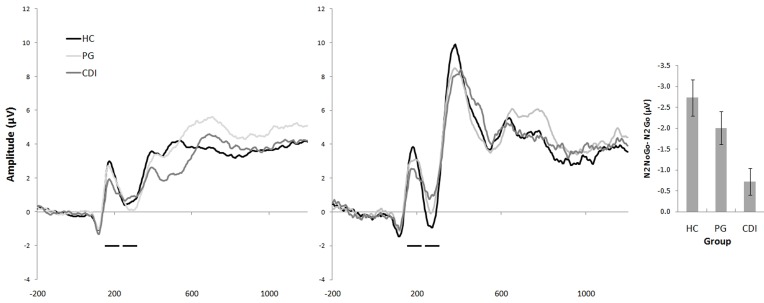
Figure 1.
ERP waveform across groups (HC: Healthy Controls, PG: Pathological gamblers, CDI: Cocaine-dependent individuals) at FCz, time-locked to the Go stimulus (left panel), and the No-go stimulus (middle panel). The right panel displays the No-go > Go N2 difference (the difference in N2 amplitudes between Go and No-go stimuli) for the three groups. The marks indicate the time frames used for the computation of the No-go > Go N2 difference.

