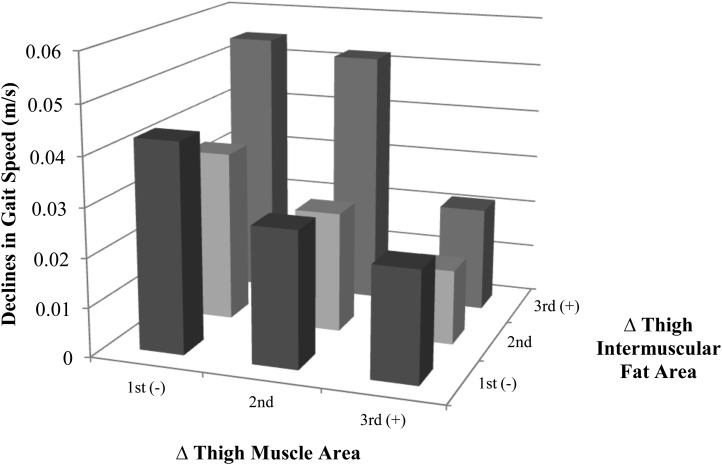
FIGURE 2.
Association between the change in gait speed and changes in thigh intermuscular fat and thigh muscle area. Variable estimates were adjusted for year, baseline (year 2) gait speed, age, race, study site, education, and height (n = 1267). Tertile 1 represents the greatest relative decrease in body-composition area, and tertile 3 represents the greatest relative increase in body-composition area. Cutoffs for the change in thigh intermuscular fat were <2.86 and ≥6.95 cm2 and for the change in thigh muscle area were less than −15.29 and at least −1.84 cm2. Participants who lost the most thigh muscle area and gained the most thigh intermuscular fat saw the greatest declines (ie, 0.05 m/s) in gait speed over the 4-y period.

