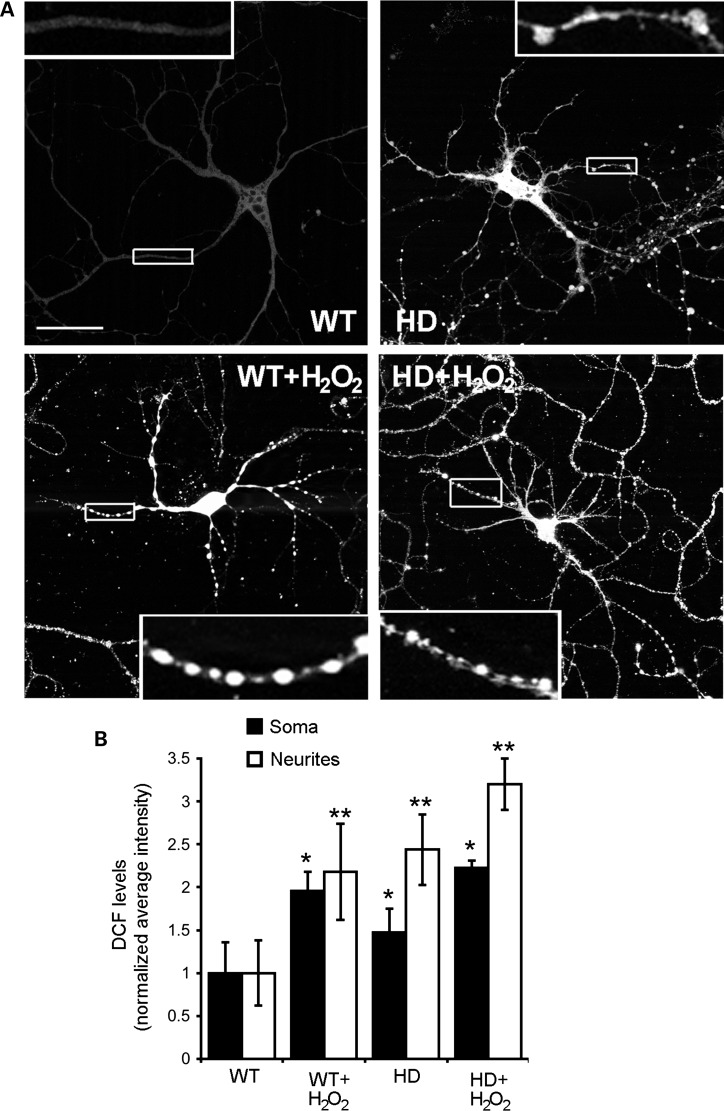
Figure 4.
ROS levels and neurite varicosities increase in WT and HD140Q/140Q cortical neurons treated with H2O2. (A) Shown are confocal images of DCF-labeled WT and HD140Q/140Q cortical neurons that were untreated or treated with 100 μm H2O2 as explained in the Materials and Methods. Insets are higher magnification images of the boxed areas of the neurite. Varicosities are prominent in H2O2-treated neurons compared with untreated neurons. Scale bar in (A) represents 25 μm. (B) Quantitative analysis of average intensity of DCF fluorescence in soma and neurites of H2O2-treated neurons relative to untreated WT neurons. Mean ± SD, soma: WT 1.00 ± 0.36; WT + H2O2 1.96 ± 0.22; HD 1.47 ± 0.28; HD + H2O2 2.30 ± 0.08. Neurites: WT 1.00 ± 0.38; WT + H2O2 2.18 ± 0.56; HD 2.44 ± 0.41; HD + H2O2 3.20 ± 0.30, n = 22 neurons analyzed per group in three independent experiments, Student's t-test, *P < 0.001 versus untreated WT neurons, **P < 0.005 versus untreated HD140Q/140Q neurons.

