Figure 9.
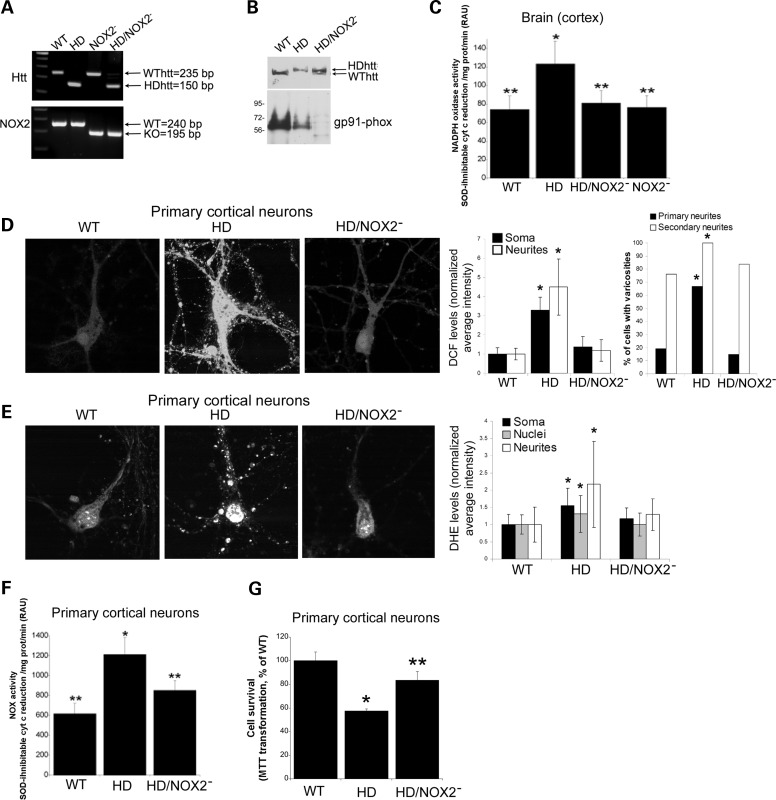
Knocking-out gp91-phox protects HD140Q/140Q neurons from elevated ROS, increased NOX activity and cell death. (A) HD140Q/140Q mice were crossed to NOX2− mice to obtain HD/NOX2− as described in Materials and Methods. PCR assay was performed using tails as source of DNA and PCR products were run in agarose gel shown here. Indicated are the sizes of DNA bands expected if genes for WT or mutant Htt and gp91-phox genes are present. (B). Western blots of cortical lysates probed with anti-Htt and anti-gp91-phox antibodies. HD/NOX2− mice do not express gp91-phox protein. (C) NOX activity was determined based on measurement of SOD-inhibitable cytochrome C reduction as described in Materials and Methods. NOX activity in HD/NOX2− cortex is comparable with the cortex of WT and NOX2− mice and significantly lower than in HD140Q/140Q cortex. Student's t-test *P < 0.007 versus untreated WT neurons (n = 3); ** P < 0.003 versus untreated HD140Q/140Q neurons (n = 4). (D) Images of DCF fluorescence in primary cortical neurons from WT, HD140Q/140Q and HD/NOX2− mice. Bar graph shows mean ± SD intensity of DCF fluorescence in somata and neurites. Data are normalized to WT neurons (n = 42). Average DCF fluorescence in HD140Q/140Q neurons (n = 48) is elevated and in HD/NOX2− neurons (n = 61) is comparable with WT (Soma: WT 1.00 ± 0.34, HD 3.28 ± 0.69, HD/NOX2− 1.37 ± 0.55 *P < 1.5 × 10⁻³³ compared with WT neurons; neurites: WT 1.00 ± 0.31, HD 4.50 ± 1.46, HD/NOX2− 1.20 ± .056, *P < 1.8 × 10⁻²⁶ compared with WT neurons). Right bar graph depicts the percent of neurons with varicosities in primary and secondary neurites. More HD140Q/140Q neurons have varicosities than do WT neurons or HD/NOX2− neurons. χ2, *P < 0.003 for HD140Q/140Q neurons (n = 48) compared with WT neurons (n = 42) and compared with HD/NOX2− neurons (n = 61). (E) Images of DHE fluorescence in primary cortical neurons from WT, HD140Q/140Q and HD/NOX2− mice. Bar graph shows mean intensity of DHE fluorescence in somata and neurites. Data are normalized to WT neurons (n = 15). Average DHE fluorescence in HD140Q/140Q neurons (n = 28) is elevated and in HD/NOX2− neurons (n = 52) is comparable with WT (Soma: WT 1.00 ± 0.29, HD 1.54 ± 0.51, HD/NOX2− 1.18 ± 0.29; Nuclei: WT 1.00 ± 0.27, HD 1.31 ± 0.53, HD/NOX2− 1.00 ± 0.33; Neurites: WT 1.00 ± 0.50, HD 2.17 ± 1.25, HD/NOX2− 1.29 ± 0.46, *P < 0.05 compared with WT neurons). (F) NOX activity was determined in lysates of primary cortical neurons using measurement of SOD-inhibitable cytochrome c reduction as described in Materials and Methods. NOX activity in HD/NOX2− neurons is comparable with that of WT and NOX2− neurons and significantly lower than HD140Q/140Q neurons. Student's t-test *P < 0.01 (n = 3, triplicate samples in three experiments) versus WT neurons (n = 3); **P < 0.03 versus HD140Q/140Q neurons). (G) Neuron survival was determined at 10 DIV using the MTT assay as described in Materials and Methods. Mean ± SD percent MTT transformation for HD and HD/NOX2− is shown normalized to WT. Student's t-test, *P < 1.3 × 10⁻¹³ versus WT neurons and **P < 5.6 × 10⁻⁶ HD/NOX2− versus HD140Q/140Q neurons, n = 12 samples from three independent cultures.

