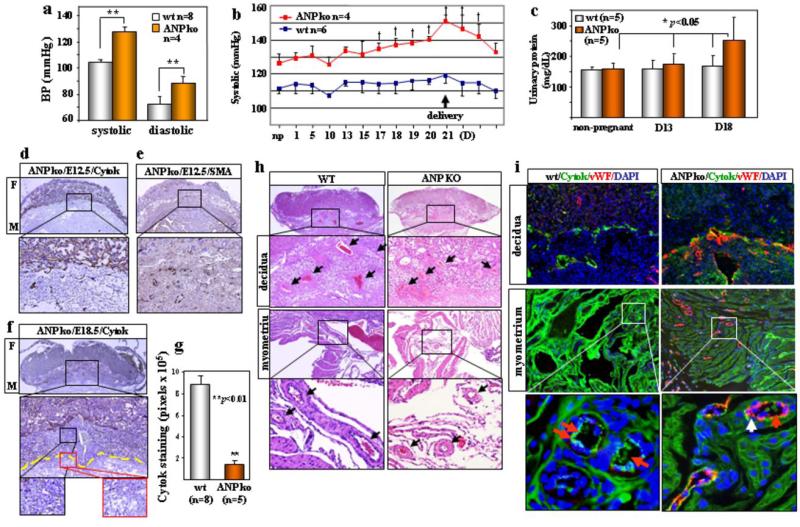
Figure 3. Hypertension, proteinuria and uteroplacental pathology in pregnant ANP ko mice.
a, BP (mean ± s.d.) in np females, **P<0.01. b, Elevated BP (mean ± s.d.) in pregnant ANP ko mice. †P<0.05 vs. np level. c, Gestational proteinuria in ANP ko mice. Data represent mean ± s.d. Impaired trophoblast invasion and smooch muscle remodeling in E12.5 embryos stained for cytok (d) or SMA (e). Boxed areas in top panels are shown at a higher magnification (x200). f, Impaired trophoblast invasion in E18.5 embryos stained for cytok. g, Quantitative data (mean ± s.d.) of cytok staining in E18.5 ANP ko embryos. h, Impaired decidual and myometrial artery remodeling (arrows) in H&E-stained E18.5 ANP ko embryos. i, Co-staining of cytok, vWF and nuclei in E18.5 ANP ko embryos. Red arrows indicate cytok (green) signals and white arrows vWF (red) signals.

