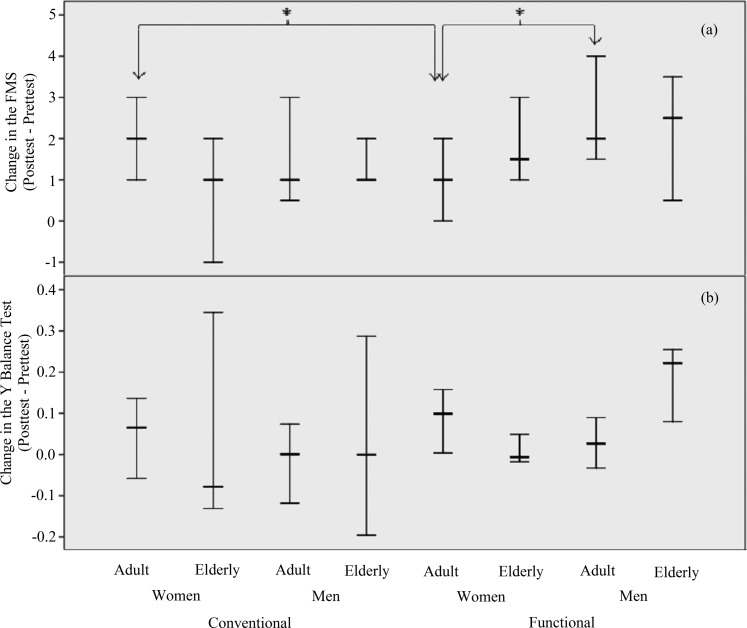
Figure 4.
The change (Posttest minus Pretest) of the groups analyzed in the third comparisons. The error bars represent the median and the first and third quartiles of the change on (a) Functional Movement Screen™ and (b) Y Balance Test. The asterisks mean the significant differences between groups pointed by the arrow (p<0.05).

