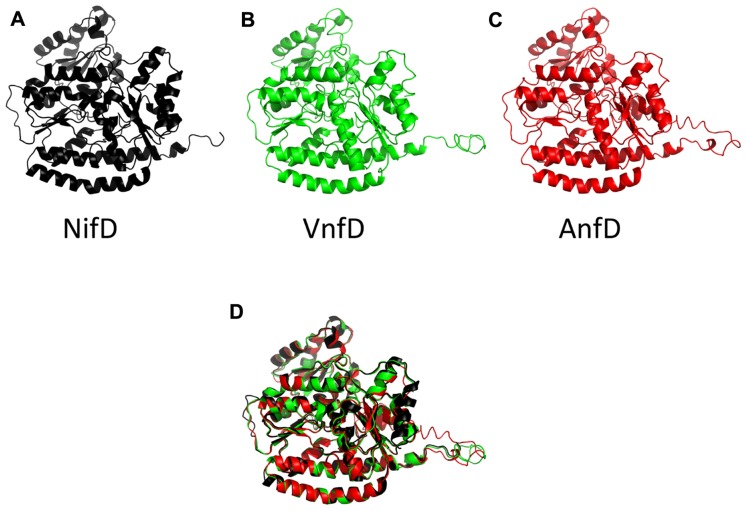
FIGURE 3.
Cartoon diagram of the A.vinelandii nitrogenase D subunits. The NifD structure, drawn from 1M1N is in black (A), and predicted structures for the A. vinelandii vanadium (VnfD) and Fe-only (AnfD) homologs are in green (B) and red (C), respectively. A structural superposition of the three as performed in PyMol is shown in (D).

