
Figure 1.
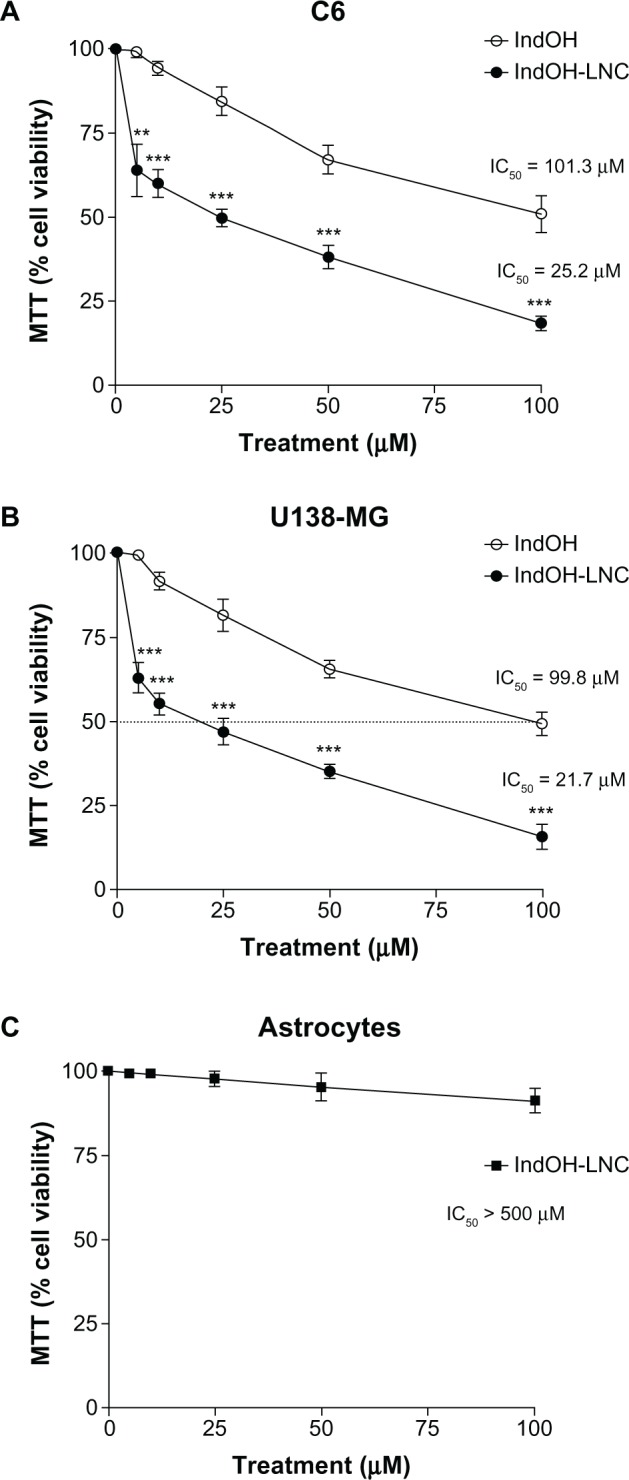
Effect of IndOH and IndOH-LNC on the cell viability of gliomas and astrocytes. (A) C6 and (B) U138-MG glioma cell lines and (C) normal astrocytes were treated for 24 hours with different concentrations (5, 10, 25, 50, or 100 μM) of IndOH or IndOH-LNC, and MTT assays were carried out.
Notes: The dashed line represents the IC50 values. Unloaded LNC were considered the vehicle control of IndOH-LNC. The cell viability is presented relative to that of control cells (100% cell viability). The values are presented as mean ± standard deviation for six independent experiments. significant differences from control and between the respective concentrations of IndOH groups: **P < 0.01 and ***P < 0.001, as assessed by two-way analysis of variance followed by the Bonferroni post hoc test.
Abbreviations: IC50, half-maximal inhibitory concentration; IndOH, indomethacin; IndOH-LNC, indomethacin-loaded lipid-core nanocapsules; LNC, lipid-core nanocapsules; MTT, 3-(4,5-dimethylthiazol-2-yl)-2,5-diphenyltetrazolium bromide.