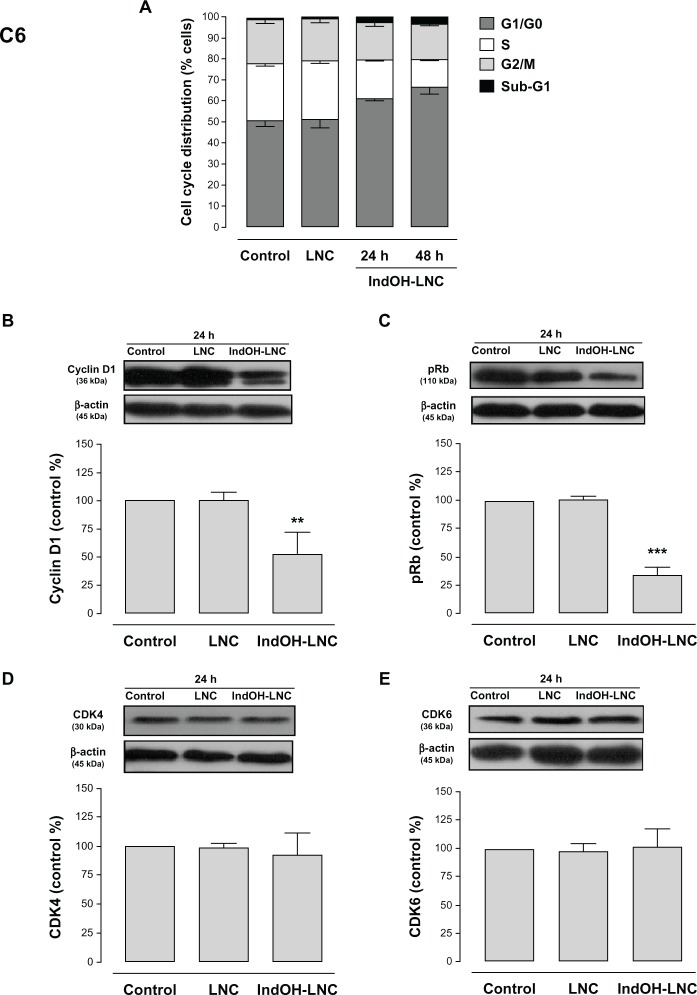
Figure 6.
Cell-cycle arrest induced by IndOH-LNC in C6 glioma cells.
Notes: Flow cytometry was performed to determine the cell-cycle distribution (sub-G1, G1/G0, S, and G2/M) in 25 μM IndOH-LNC-treated (24 and 48 hours) cells. Western blotting for cell-cycle checkpoint proteins from G0/G1 phase to S phase (cyclin D1, pRb, CDK4, and CDK6) was performed. Unloaded LNC were considered the vehicle control of IndOH-LNC. The histogram presents the quantitative Western blot analysis for the protein indicated. The densitometric values obtained from treatments were normalized to their respective controls (control bar) (100%). Bars represent the mean ± standard deviation for at least six independent experiments. significant differences from control and LNC groups: **P < 0.01, ***P < 0.001, as assessed by one-way analysis of variance followed by the Bonferroni post hoc test.
Abbreviations: IndOH-LNC, indomethacin-loaded lipid-core nanocapsules; LNC, lipid-core nanocapsules.

