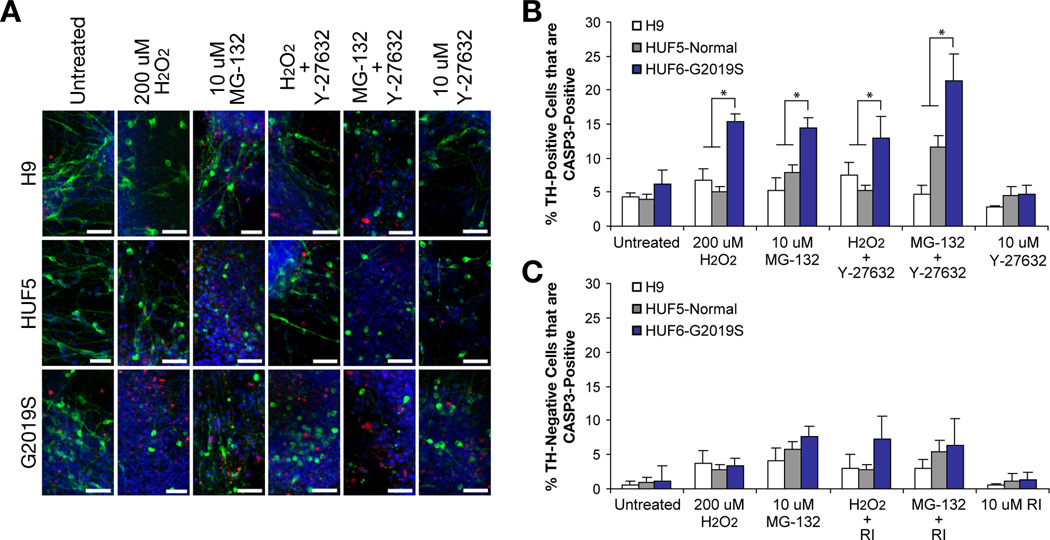
Figure 7. Effect of ROCK Inhibitor, Y-27632, on Patient-derived DA Neurons.
(A) Representations of neurodegeneration in H9-, HUF5- and G2019S-iPSC derived neurons when treated with neurotoxins, H2O2 and MG-132, and ROCK inhibitor Y-27632. Scale bar = 50 µm.
(B) Quantification of cells double positive for TH and CASP3. Data represent mean ± SEM (n = 2–3 wells per iPSC clone; average of 3 clones of HUF5 and two clones of G2019S).
(C) Quantification of TH-negative (TUJ+) neurons also positive for CASP3 after treatments as described above. Data represent mean ± SEM (n = 2 to 3 wells per clone).
See also Table S4 for cell counts.

