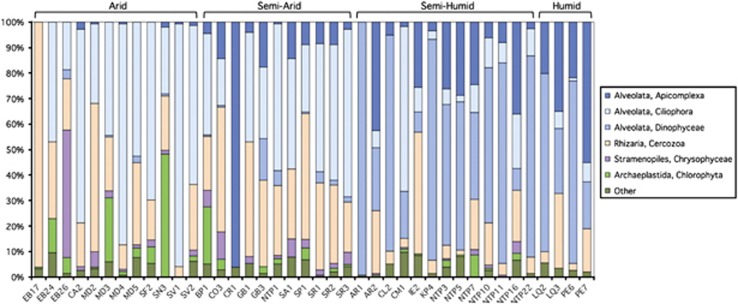
Figure 1.
Relative abundance of soil protistan taxa (y axis as group percentage of the total number of 18S rRNA gene sequences per sample, after rarefaction to correct for uneven sampling effort) grouped by general CMI class. Identities of the sites sampled are given on the x axis (see Supplementary Table S1 for specific details on site and soil characteristics).

