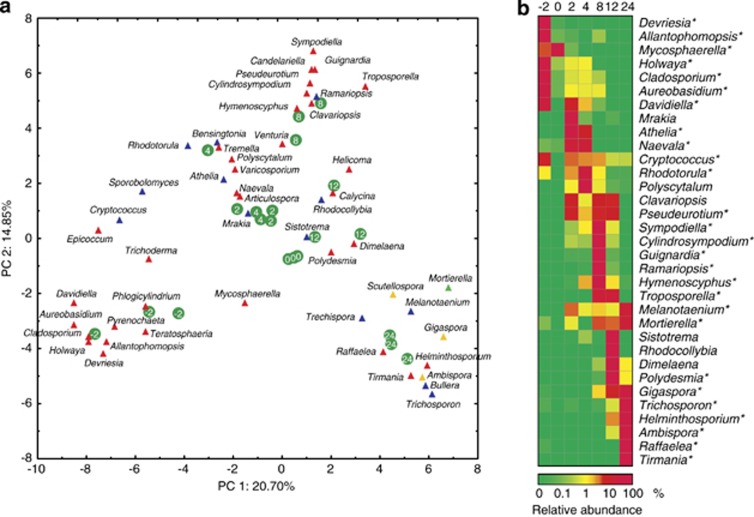
Figure 2.
(a) Principal component analysis of the relative abundance of the 50 most abundant fungal genera in Q. petraea live leaves and leaves at different stages of decomposition. Ascomycota—red, Basidiomycota—blue, Glomeromycota—yellow, Mucoromycotina—green. Green circles with numbers indicate the positions of individual samples (litterbags) with ages in months. (b) Time course of the relative abundance of dominant fungal genera in Q. petraea live leaves and leaves at different stages of decomposition. Mean abundances are shown for each time point. A statistically significant effect of time on abundance is indicated by an asterisk (P<0.05, analysis of variance (ANOVA) followed by Fisher's post hoc test).

