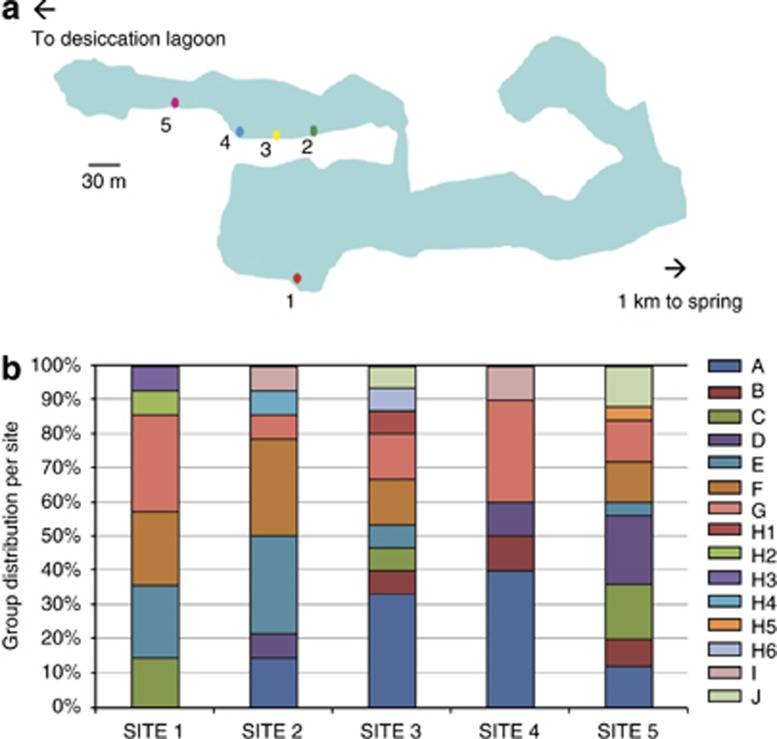
Figure 1.
Sampling sites in the Churince system and taxonomic distribution of isolates. (a). A schematic map of the Churince system showing the location of the sampling points. (b). The distribution of the isolates belonging to different taxonomic groups is shown as a bar at each site, and the proportion of members belonging to the different groups is shown in different colors. Taxonomic groups A to J were obtained on the basis of the 16S rRNA gene and members in each group have at least 97% identity (see Materials and methods).

