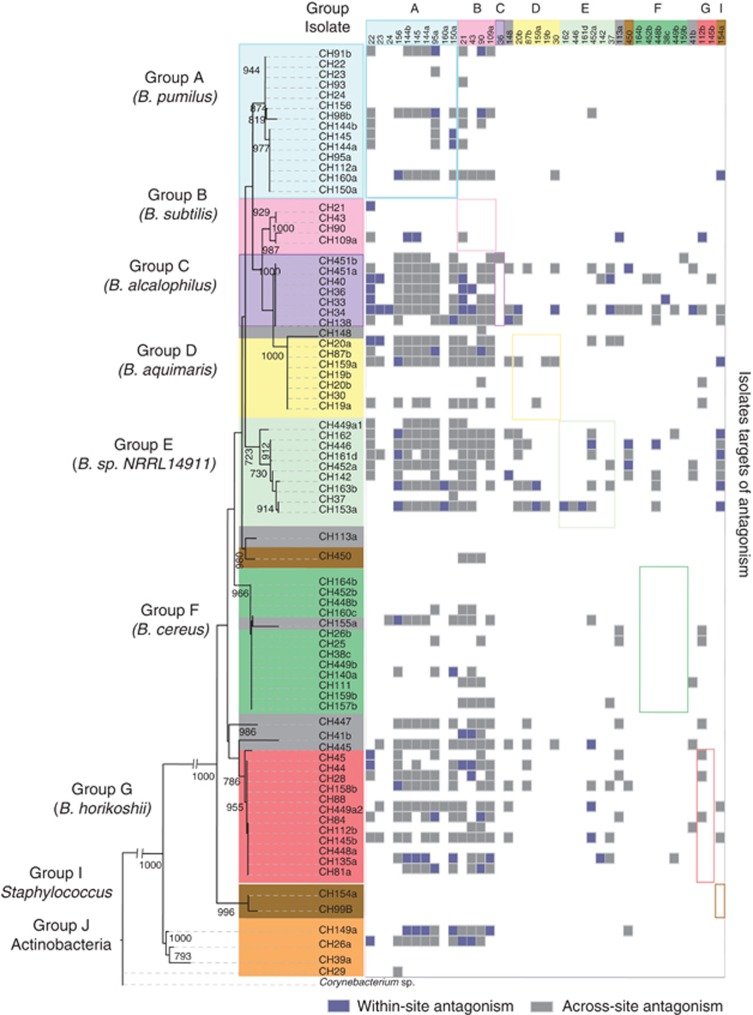
Figure 2.
Taxonomic grouping and antagonist and sensitivity properties of the isolates. On the left a phylogenetic tree of all the strains isolated (78), showing the closest assigned phylotype in each cluster (see Materials and Methods). The top lane of the matrix shows the 39 antagonist isolates; the other 39 isolates did not produce antagonism against any of the 78 isolates tested. Small colored squares in the intersections represent antagonism events where the isolate shown above antagonizes an isolate from the left column. The gray colored squares indicate that the isolates involved have a different site as the source (across-site), and the blue colored squares indicate that both the antagonist and sensitive isolates came from the same site (within-site). Large squares with colored perimeter frame the intersection among members of the same taxonomic group.

