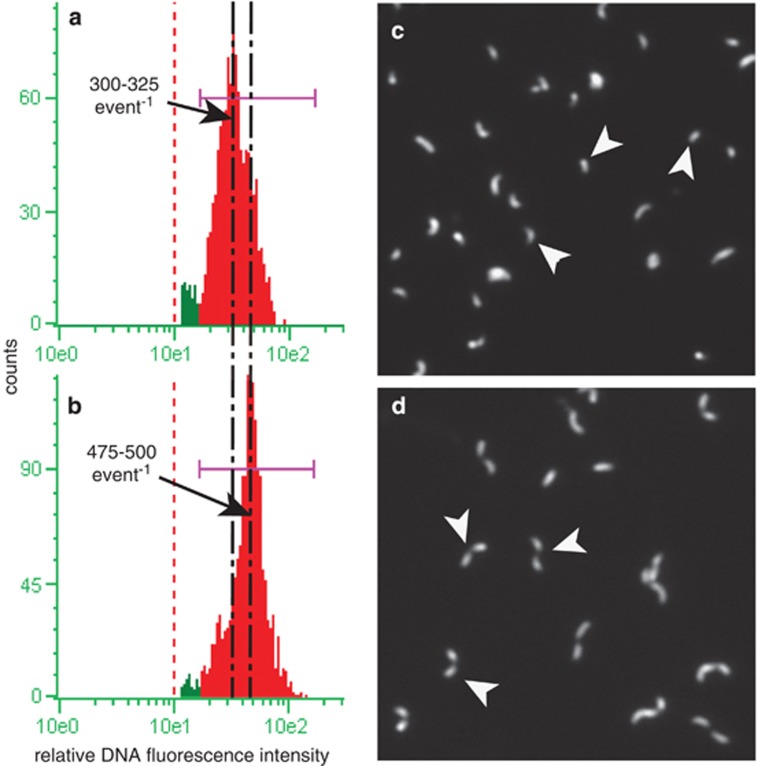
Figure 4.
DNA content and morphology of SYBR Green I-stained stationary-phase cells from pyruvate-deplete and -replete batch cultures. Red dashed line in a and b represents the minimum threshold of fluorescence detection. Black dashed lines in a and b represent relative DNA fluorescence values of 300–325 per event and 475–500 per event, as indicated with black arrows. (a) Relative DNA fluorescence of cells from pyruvate-replete (50 μℳ) stationary-phase cultures, and (b) pyruvate-deplete (0.5 μℳ) stationary-phase cultures. (c) Fluorescent microscopy image of cells from (a). Arrowheads point to single cells. (d) Fluorescent microscopy image of cells from (b). Arrowheads point to cell doublets.

