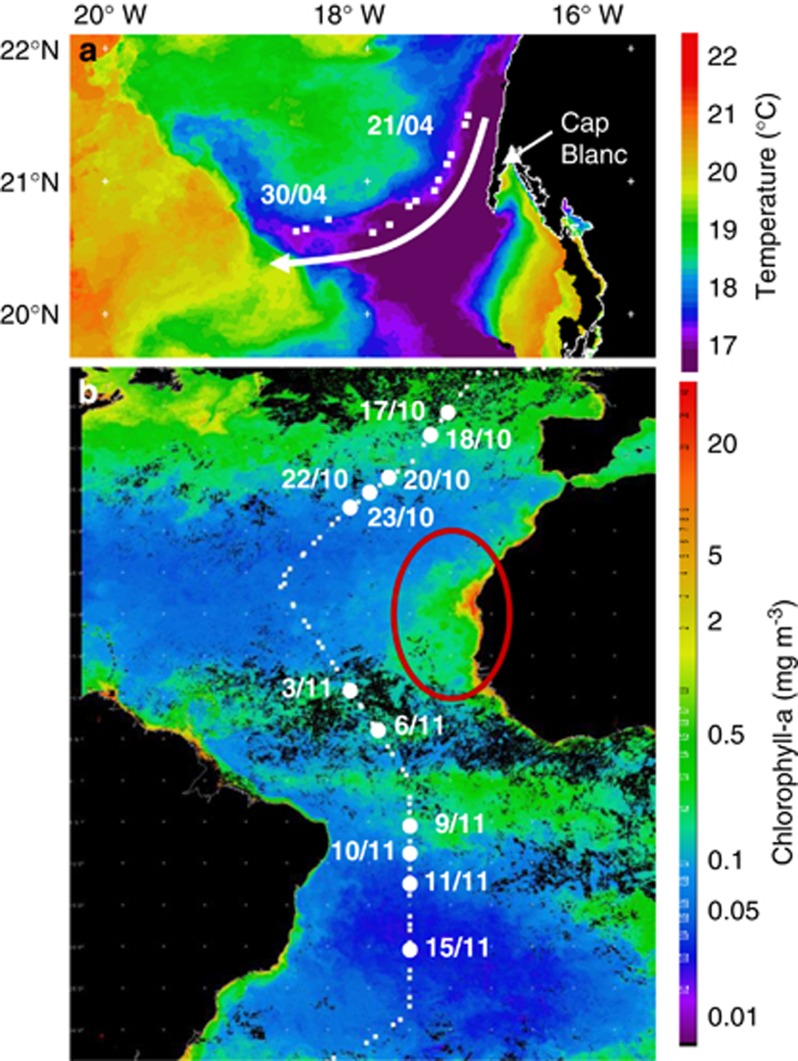
Figure 1.
Study area showing (a) AVHRR image of sea surface temperature showing the cold water filament, which was sampled during 21–30 April 2009 where the arrow indicates the direction of filament flow away from the coast, and (b) remotely sensed MODIS—Aqua chlorophyll a composite image from November 2009. The red oval shows the high concentrations associated with the Mauritanian upwelling. White squares show station positions, while white circles and corresponding station numbers (sampling date) show location of methanol uptake experiments during AMT19. These images are courtesy of NEODAAS.

