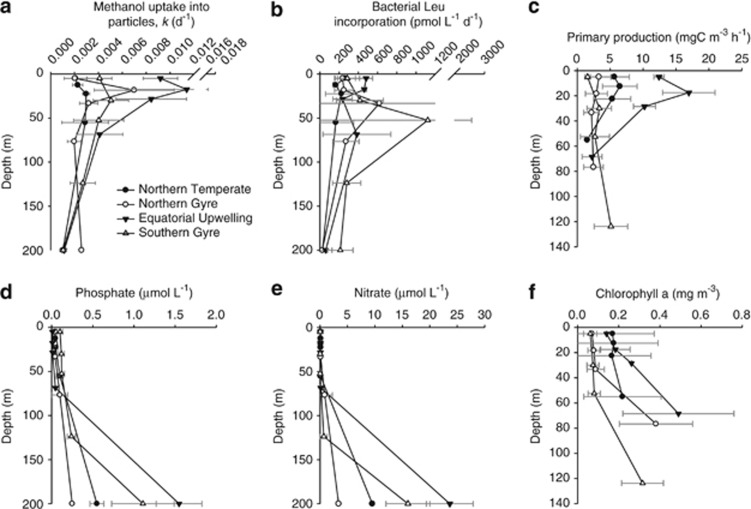
Figure 3.
Depth profiles (97–1% PAR equivalent) of biogeochemical parameters (a) methanol uptake into particles, (b) bacterial leucine incorporation, (c) rates of primary production and concentrations of (d) phosphate, (e) nitrate and (f) chlorophyll a determined in different provinces of the Atlantic Ocean. The profiles represent the average found in each province where for NT n=2, NG n=3, EU n=2, SG n=4. For each individual profile the number of replicate at each depth were ⩾3.

