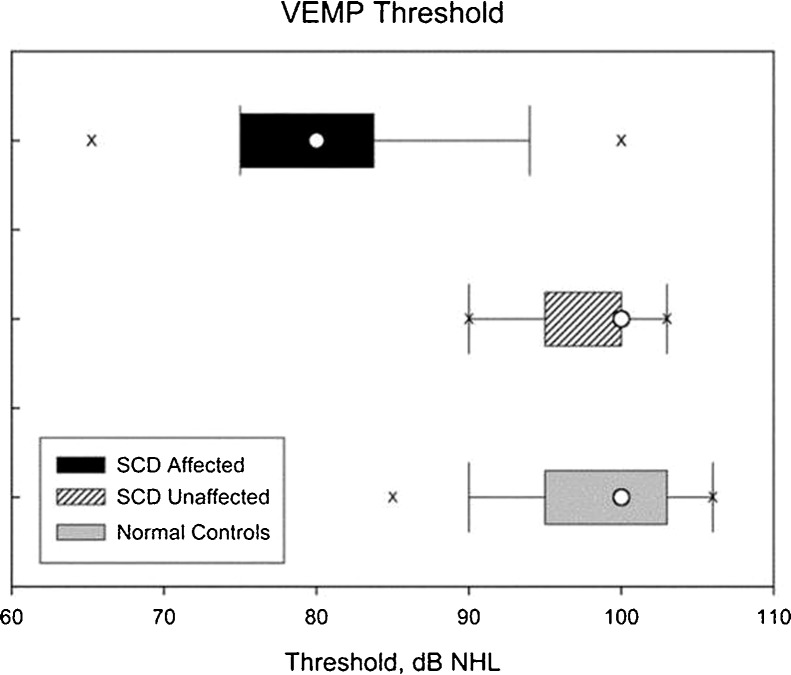
Figure 5.
Thresholds for vestibular-evoked myogenic potential response elicitation were recorded in 141 ears: 51 ears affected by superior semicircular canal dehiscence (SSCD), 30 normal ears in patients with SSCD in the contralateral ear, and 60 unaffected ears as controls. The boxes for these three groups represent the interquartile range, which spans from the 25th to 75th percentile. The whiskers represent the 10th to 90th percentile range, and the two lowercase Xs signify the 5th and 95th percentile range. The median threshold is indicated by the white circle. (Reprinted with permission from Minor LB. Clinical manifestations of superior semicircular canal dehiscence. The Laryngoscope 2005;115:1717–1727.)

