
Figure 2.
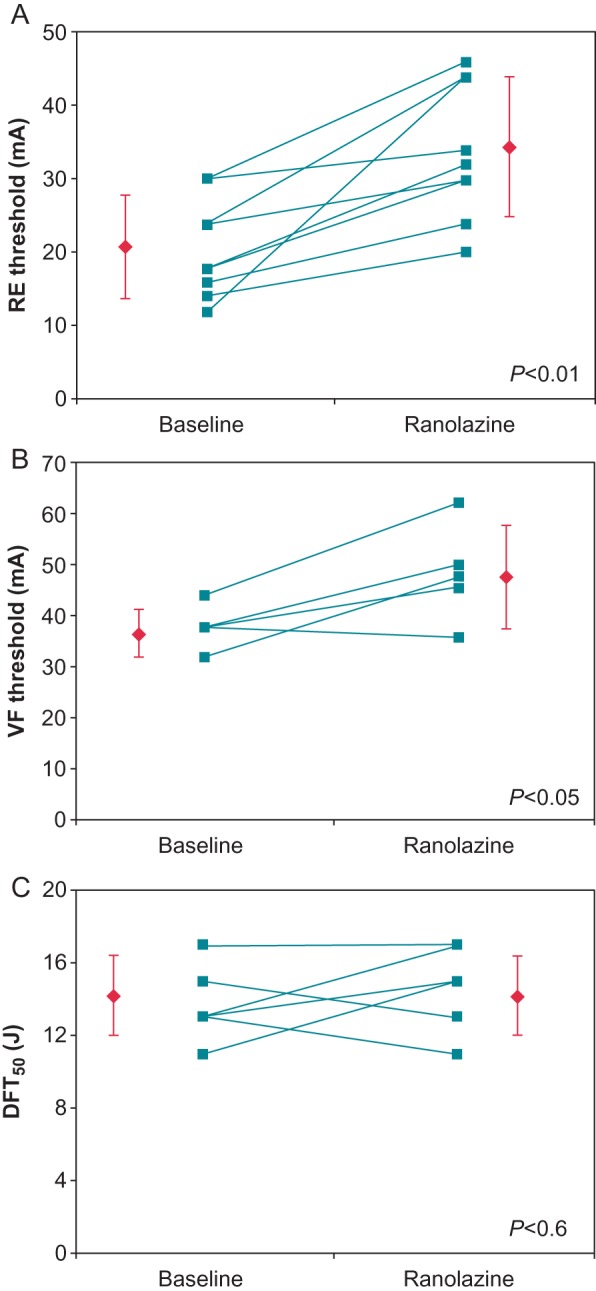
Connected dot plots of the (A) repetitive extrasystole (RE) (N= 9), (B) ventricular fibrillation (VF) (N = 5), and (C) 50% probability of defibrillation (DFT50) (N = 6) thresholds. Each line represents an individual experiment, while the diamonds represent the means ± SD. (Reprinted from ref.23 with permission from John Wiley & Sons.)