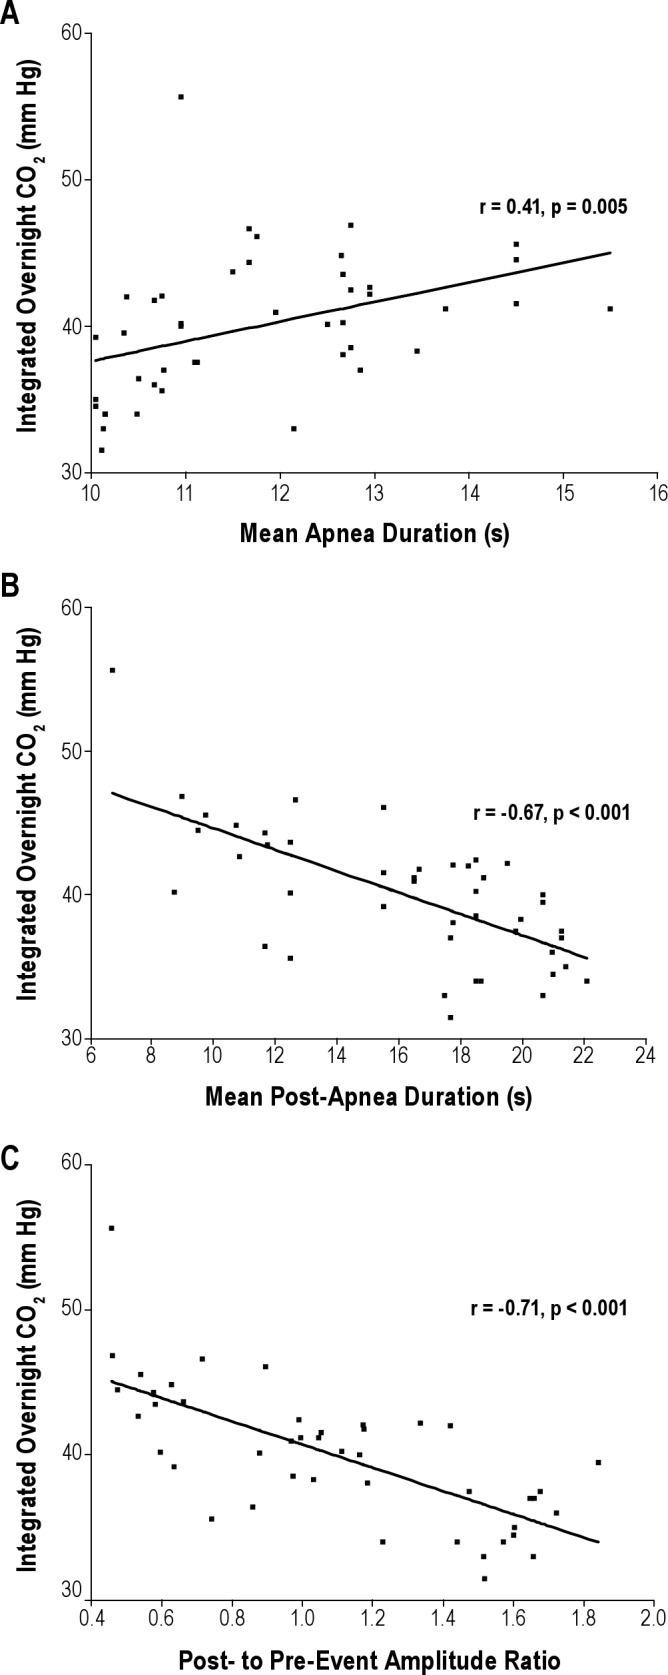
Figure 2. Scatter plots of the integrated overnight CO2 against mean apnea duration (A), mean post-apnea duration (B), and mean post-to mean pre-event amplitude ratio (C), with regression line, correlation coefficient, and significance.

Each point represents one patient.
