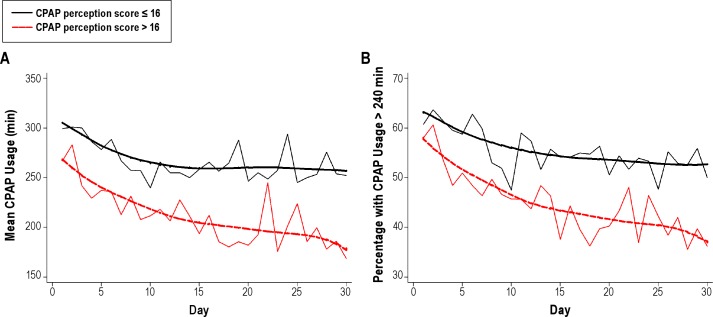
Figure 2. CPAP perception score predicts nightly CPAP use and percentage of patients with ≥ 4 hours nightly CPAP use.
The mean CPAP perception score was used to create two categories of patients: poor CPAP perception (scores > 16) and good CPAP perception (scores ≤ 16). Higher scores on the CPAP perception score were associated with decreased nightly CPAP usage (A) p = 0.001. Similarly, higher scores on the CPAP perception score were associated with a decreased percentage of patients using CPAP ≥ 4 hours each night (B) p < 0.001. Lowess smooth curves were added to summary plots to aid in assessment of trends.

