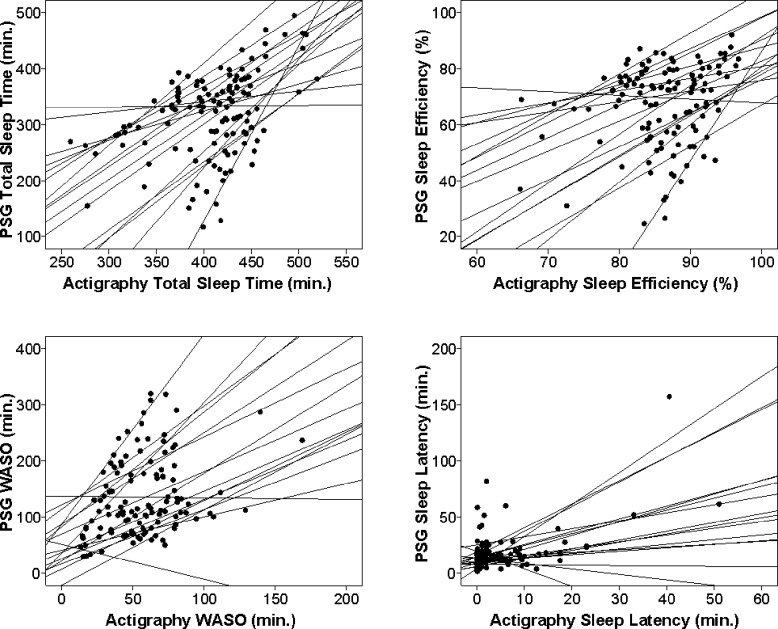
Figure 1. Scatterplots showing the relationship between actigraphy and PSG sleep outcomes within subjects.
Data points represent a subject on one night of measurement (4-8 data points per subject). Lines represent the within-subject relationship between PSG and actigraphy. The graphs show linear relationships between PSG and actigraphy on total sleep time (A) and WASO (C) within participants. The graph shows a positive linear relationship between PSG and actigraphy on sleep efficiency (B) for most participants, but of low magnitude, as reflected in the nonsignificant results on the generalized linear model analysis. Although the scatterplot and generalized linear model show overall agreement between PSG and actigraphy on sleep latency, the within-subject lines (D) show substantial variability within the sample.

