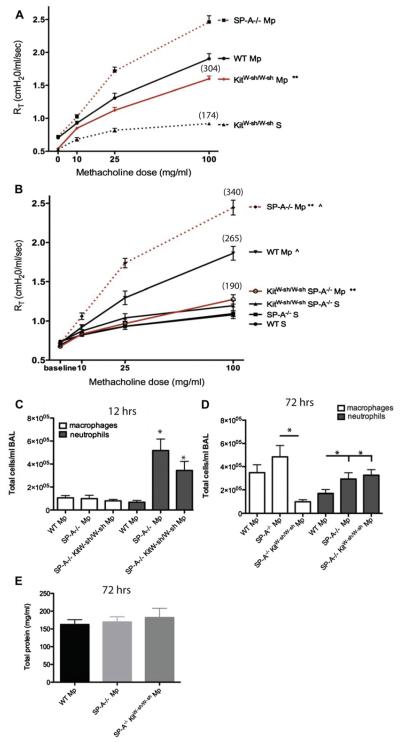
FIG 3.
Contribution of MCs to AHR and inflammation. A and B, Three days after Mycoplasma pneumoniae (Mp), AHR to methacholine challenge was measured by using the Flexivent system. Mean percentage over baseline for highest methacholine dose is shown in parentheses. **P < .01 and ^P < .01, 3 independent experiments per graph. C and D, Cells in BAL fluid 12 hours (Fig 3, C) or 72 hours (Fig 3, D) after infection. *P < .05 versus WT M pneumoniae unless otherwise noted. E, Total protein in BAL fluid, n ≥ 12 mice per group.

