
Fig. 10.
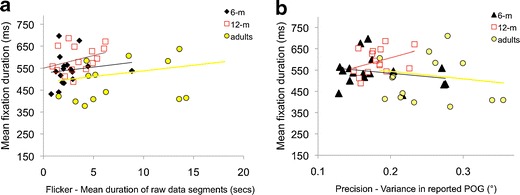
Quantifying how fixation duration varies as a function of data quality. The relationship between fixation durations as analyzed using our new algorithms and data quality, evaluated in two ways: a flicker, the mean duration of raw data segments, and b precision, the variance in reported point of gaze (POG). This recreates the analyses shown in Fig. 3