
Fig. 7.
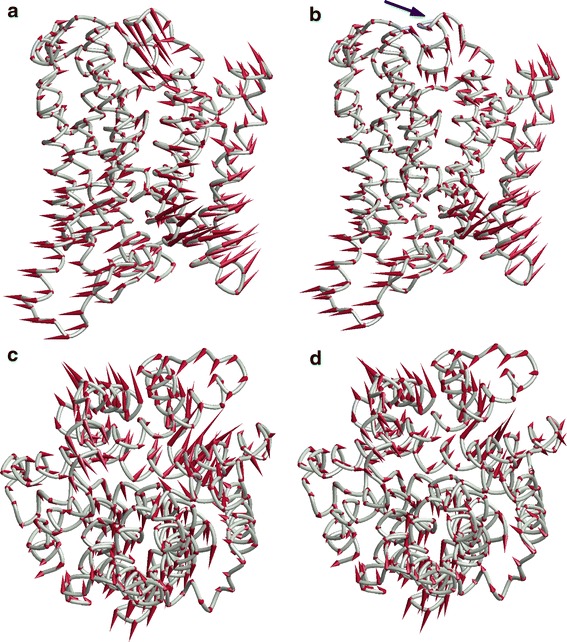
Visualization of the CSec → Ci transition of Mhp1 from the crystal structures of the starting and end conformation (left) and from the crystal structure of the starting conformation and the ANM fit result R f for the end conformation (left). a View parallel to the membrane (periplasmic side up) of a coil model of structure 2JLO (CSec conformation) with motion cones pointing to Cα atom locations in structure 2X79 (Ci conformation). b View parallel to the membrane of a coil model of structure 2JLO with motion cones pointing to Cα atom locations in the ANM fit result R f. c View normal to the membrane from the periplasmic side of a coil model of structure 2JLO with motion cones pointing to Cα atom locations in structure 2X79. d View normal to the membrane of a coil model of structure 2JLO with motion cones pointing to Cα atom locations in the ANM fit result R f