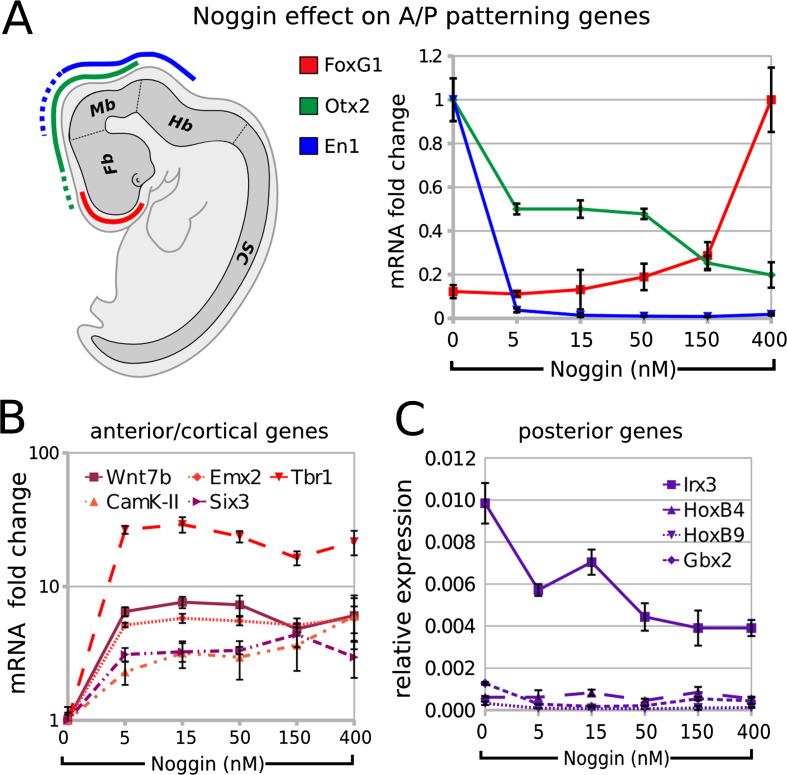
Fig. 5.
Effects of BMP inhibition on the expression of A/P patterning genes: a A/P (color code) patterning of mouse embryonic brain by FoxG1, Otx2 and En1. Fb forebrain, Mb midbrain, Hb hindbrain, SC spinal cord. Graph shows RT-PCR mRNA quantification of FoxG1, Otx2 and En1 in ESCs at the end of step III after differentiation in CDMM (0) or in CDMM plus 5–400 nM Noggin (normalized on maximum expression). b, c RT-PCR mRNA quantification of forebrain/cortical markers (b) or hindbrain/spinal cord markers (c), in cells as in A (ratio over β-Actin). Error bars standard error

