
Fig. 2.
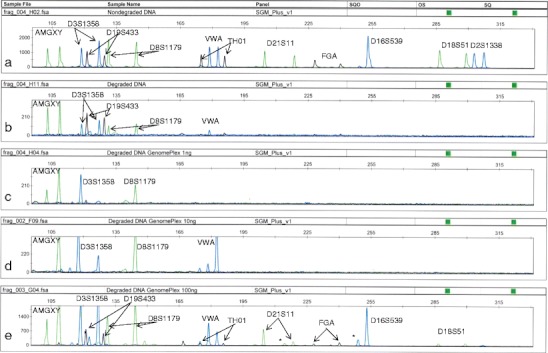
Comparison of SGMPlus profiles of DNA obtained from male muscle tissue. a Nondegraded, native DNA; b DNA degraded to ca 200 bp; c, d, e degraded DNA preamplified by using GenomePlex amplification of 1, 10, and 100 ng, respectively. Asterisk indicates stutters (n-4 fraction)