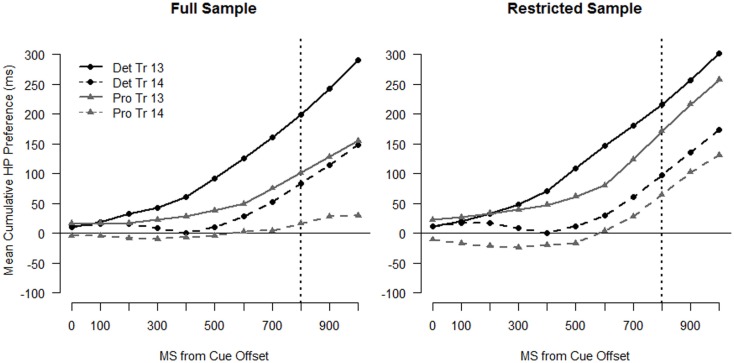
Figure 7.
Cumulative preference profiles for Trials 13 and 14. The left panel depicts data from the full sample and the right panel depicts data from the restricted sample. Points above 0 indicate a preference for the HP location and points below 0 indicate a preference for the LP location. The dotted vertical line indicates target onset.

