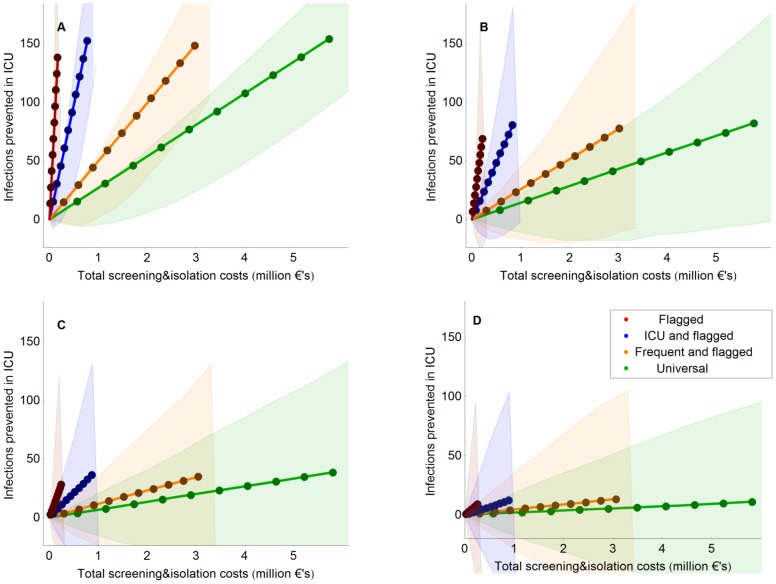
Figure 2. Number of infections prevented in ICUs and the cost of the intervention during the first 10 years after implementation.
Isolation efficacy was 100% (A), 50% (B), 25% (C) and 10% (D). The credibility intervals denote the uncertainty due to the inherent stochasticity of the dynamics of MRSA and contain 90% of our simulation results. The 10 dots correspond to the means after 1,2,…,10 years.

